In statistics, linear regression models are used to quantify the relationship between one or more predictor variables and a response variable.
We can use the following general format to report the results of a simple linear regression model:
Simple linear regression was used to test if [predictor variable] significantly predicted [response variable].
The fitted regression model was: [fitted regression equation]
The overall regression was statistically significant (R2 = [R2 value], F(df regression, df residual) = [F-value], p = [p-value]).
It was found that [predictor variable] significantly predicted [response variable] (β = [β-value], p = [p-value]).
And we can use the following format to report the results of a multiple linear regression model:
Multiple linear regression was used to test if [predictor variable 1], [predictor variable 2], … significantly predicted [response variable].
The fitted regression model was: [fitted regression equation]
The overall regression was statistically significant (R2 = [R2 value], F(df regression, df residual) = [F-value], p = [p-value]).
It was found that [predictor variable 1] significantly predicted [response variable] (β = [β-value], p = [p-value]).
It was found that [predictor variable 2] did not significantly predict [response variable] (β = [β-value], p = [p-value]).
The following examples show how to report regression results for both a simple linear regression model and a multiple linear regression model.
Example: Reporting Results of Simple Linear Regression
Suppose a professor would like to use the number of hours studied to predict the exam score that students will receive on a certain exam. He collects data for 20 students and fits a simple linear regression model.
The following screenshot shows the output of the regression model:
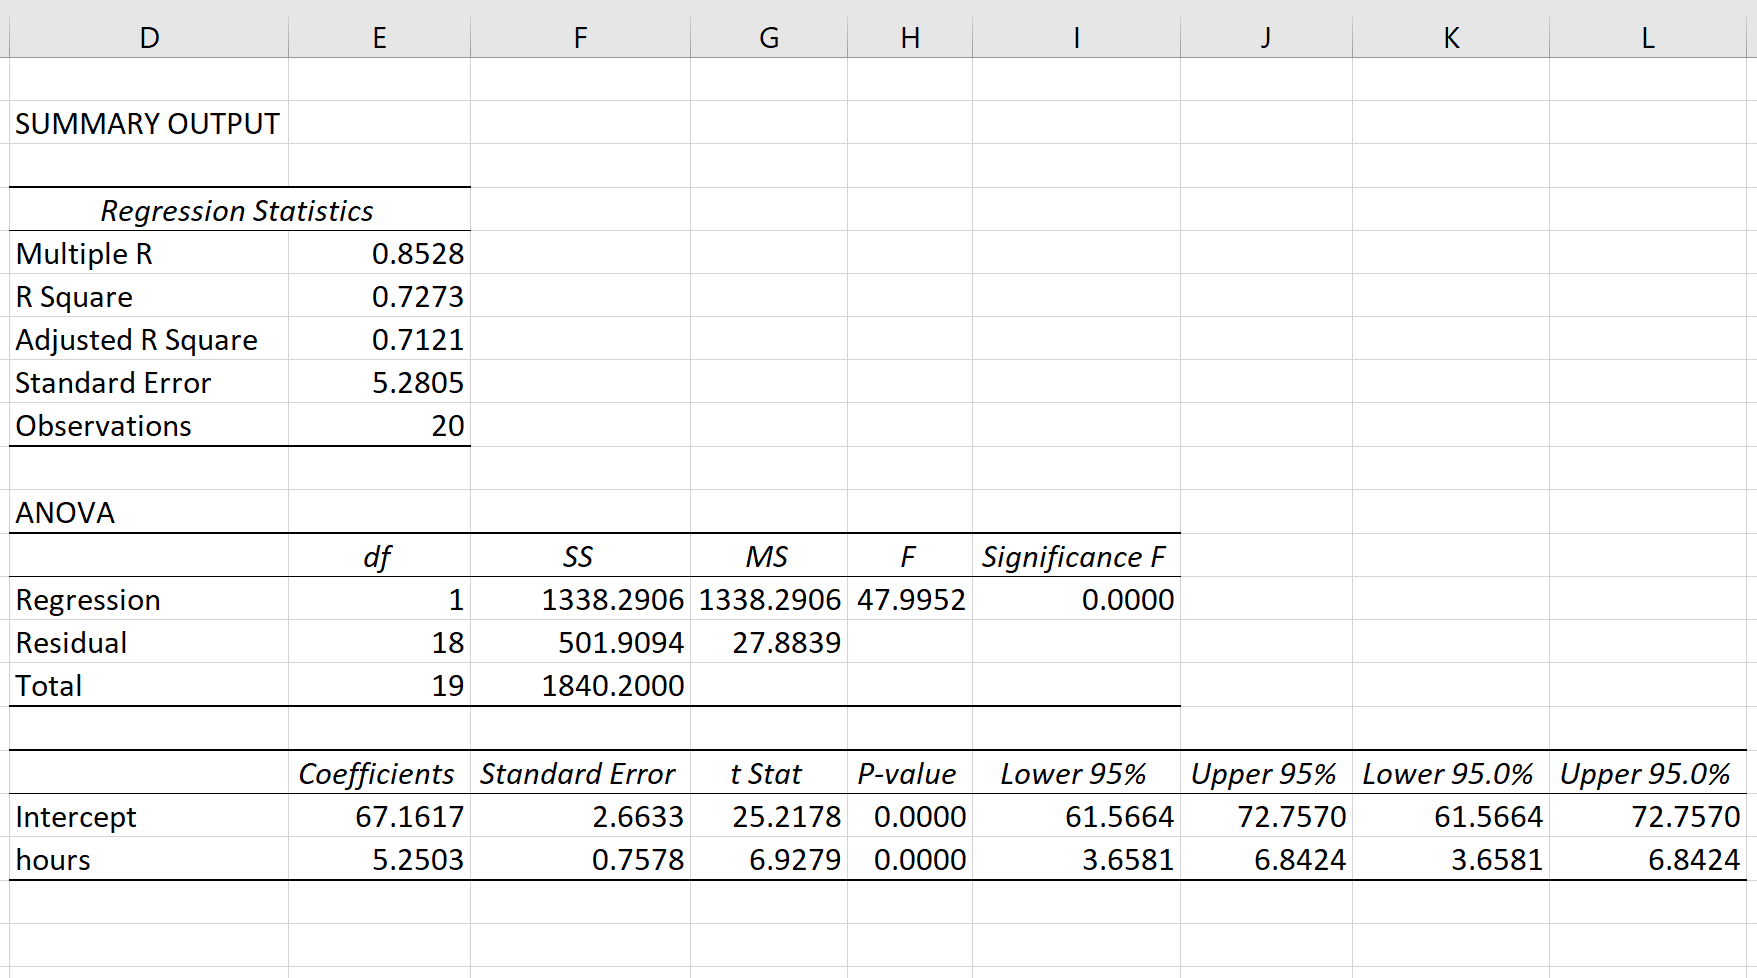
Here is how to report the results of the model:
Simple linear regression was used to test if hours studied significantly predicted exam score.
The fitted regression model was: Exam score = 67.1617 + 5.2503*(hours studied).
The overall regression was statistically significant (R2 = .73, F(1, 18) = 47.99, p
It was found that hours studied significantly predicted exam score (β = 5.2503, p
Example: Reporting Results of Multiple Linear Regression
Suppose a professor would like to use the number of hours studied and the number of prep exams taken to predict the exam score that students will receive on a certain exam. He collects data for 20 students and fits a multiple linear regression model.
The following screenshot shows the output of the regression model:
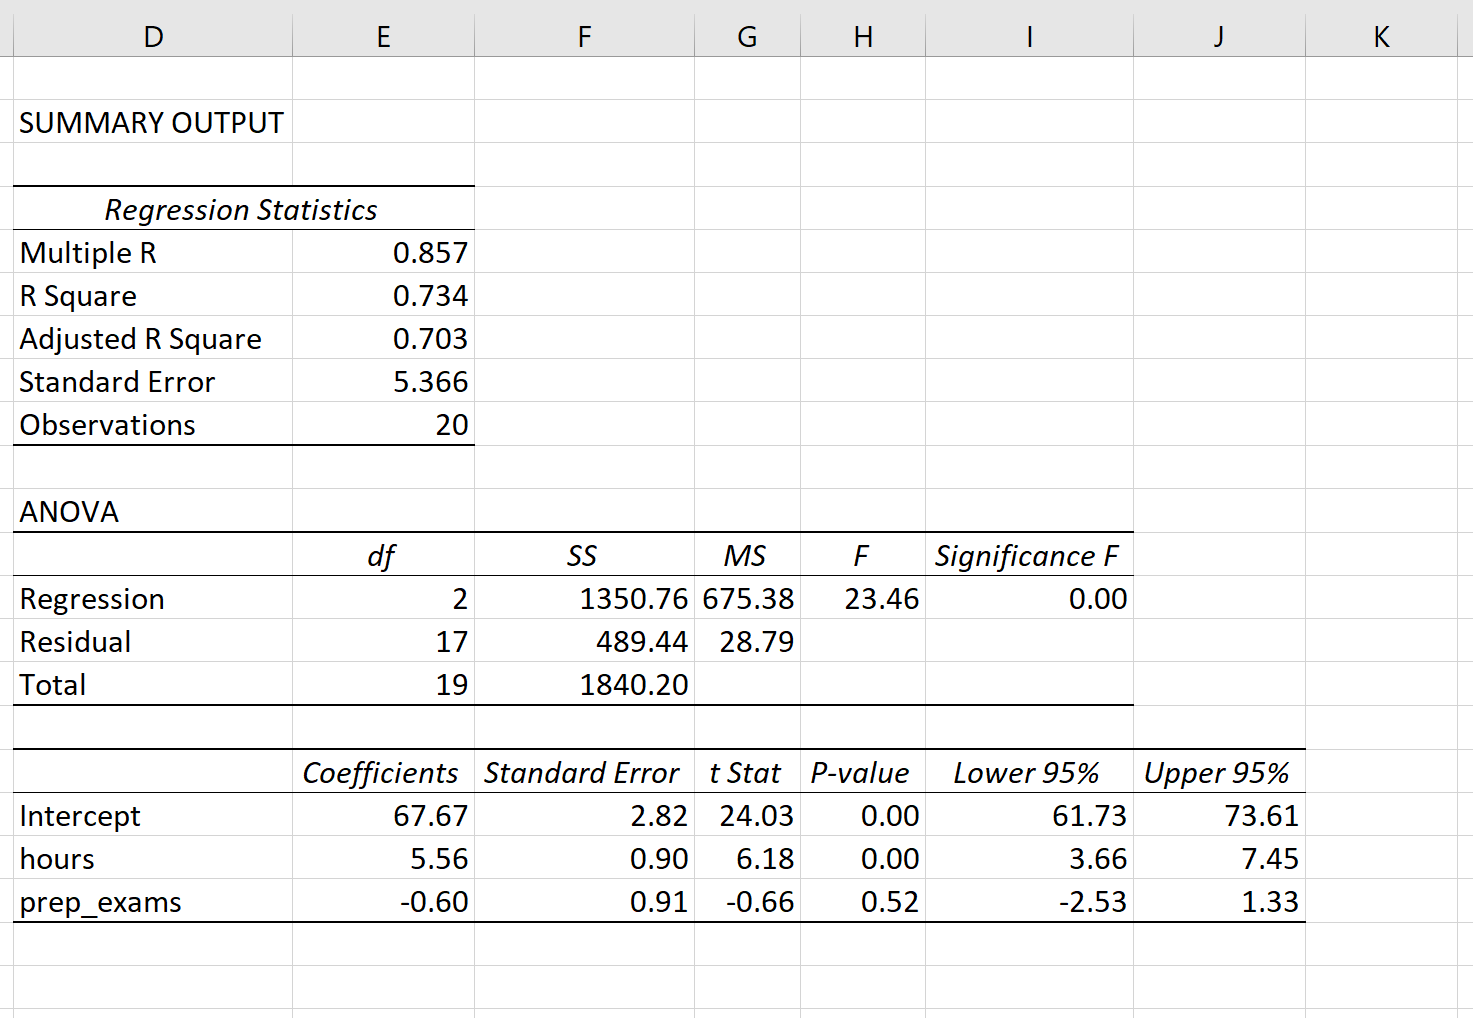
Here is how to report the results of the model:
Multiple linear regression was used to test if hours studied and prep exams taken significantly predicted exam score.
The fitted regression model was: Exam Score = 67.67 + 5.56*(hours studied) – 0.60*(prep exams taken)
The overall regression was statistically significant (R2 = 0.73, F(2, 17) = 23.46, p =
It was found that hours studied significantly predicted exam score (β = 5.56, p =
It was found that prep exams taken did not significantly predict exam score (β = -0.60, p = 0.52).
Additional Resources
How to Read and Interpret a Regression Table
Understanding the Null Hypothesis for Linear Regression
Understanding the F-Test of Overall Significance in Regression