A hypothesis test is a formal statistical test we use to reject or fail to reject a statistical hypothesis.
We always use the following steps to perform a hypothesis test:
Step 1: State the null and alternative hypotheses.
The null hypothesis, denoted as H0, is the hypothesis that the sample data occurs purely from chance.
The alternative hypothesis, denoted as HA, is the hypothesis that the sample data is influenced by some non-random cause.
2. Determine a significance level to use.
Decide on a significance level. Common choices are .01, .05, and .1.
3. Calculate the test statistic and p-value.
Use the sample data to calculate a test statistic and a corresponding p-value.
4. Reject or fail to reject the null hypothesis.
If the p-value is less than the significance level, then you reject the null hypothesis.
If the p-value is not less than the significance level, then you fail to reject the null hypothesis.
You can use the following clever line to remember this rule:
“If the p is low, the null must go.”
In other words, if the p-value is low enough then we must reject the null hypothesis.
The following examples show when to reject (or fail to reject) the null hypothesis for the most common types of hypothesis tests.
Example 1: One Sample t-test
A one sample t-test is used to test whether or not the mean of a population is equal to some value.
For example, suppose we want to know whether or not the mean weight of a certain species of turtle is equal to 310 pounds.
We go out and collect a simple random sample of 40 turtles with the following information:
- Sample size n = 40
- Sample mean weight x = 300
- Sample standard deviation s = 18.5
We can use the following steps to perform a one sample t-test:
Step 1: State the Null and Alternative Hypotheses
We will perform the one sample t-test with the following hypotheses:
- H0: μ = 310 (population mean is equal to 310 pounds)
- HA: μ ≠ 310 (population mean is not equal to 310 pounds)
2. Determine a significance level to use.
We will choose to use a significance level of 0.05.
3. Calculate the test statistic and p-value.
We can plug in the numbers for the sample size, sample mean, and sample standard deviation into this One Sample t-test Calculator to calculate the test statistic and p-value:
- t test statistic: -3.4187
- two-tailed p-value: 0.0015
4. Reject or fail to reject the null hypothesis.
Since the p-value (0.0015) is less than the significance level (0.05) we reject the null hypothesis.
We conclude that there is sufficient evidence to say that the mean weight of turtles in this population is not equal to 310 pounds.
Example 2: Two Sample t-test
A two sample t-test is used to test whether or not two population means are equal.
For example, suppose we want to know whether or not the mean weight between two different species of turtles is equal.
We go out and collect a simple random sample from each population with the following information:
Sample 1:
- Sample size n1 = 40
- Sample mean weight x1 = 300
- Sample standard deviation s1 = 18.5
Sample 2:
- Sample size n2 = 38
- Sample mean weight x2 = 305
- Sample standard deviation s2 = 16.7
We can use the following steps to perform a two sample t-test:
Step 1: State the Null and Alternative Hypotheses
We will perform the two sample t-test with the following hypotheses:
- H0: μ1 = μ2 (the two population means are equal)
- H1: μ1 ≠ μ2 (the two population means are not equal)
2. Determine a significance level to use.
We will choose to use a significance level of 0.10.
3. Calculate the test statistic and p-value.
We can plug in the numbers for the sample sizes, sample means, and sample standard deviations into this Two Sample t-test Calculator to calculate the test statistic and p-value:
- t test statistic: -1.2508
- two-tailed p-value: 0.2149
4. Reject or fail to reject the null hypothesis.
Since the p-value (0.2149) is not less than the significance level (0.10) we fail to reject the null hypothesis.
We do not have sufficient evidence to say that the mean weight of turtles between these two populations is different.
Example 3: Paired Samples t-test
A paired samples t-test is used to compare the means of two samples when each observation in one sample can be paired with an observation in the other sample.
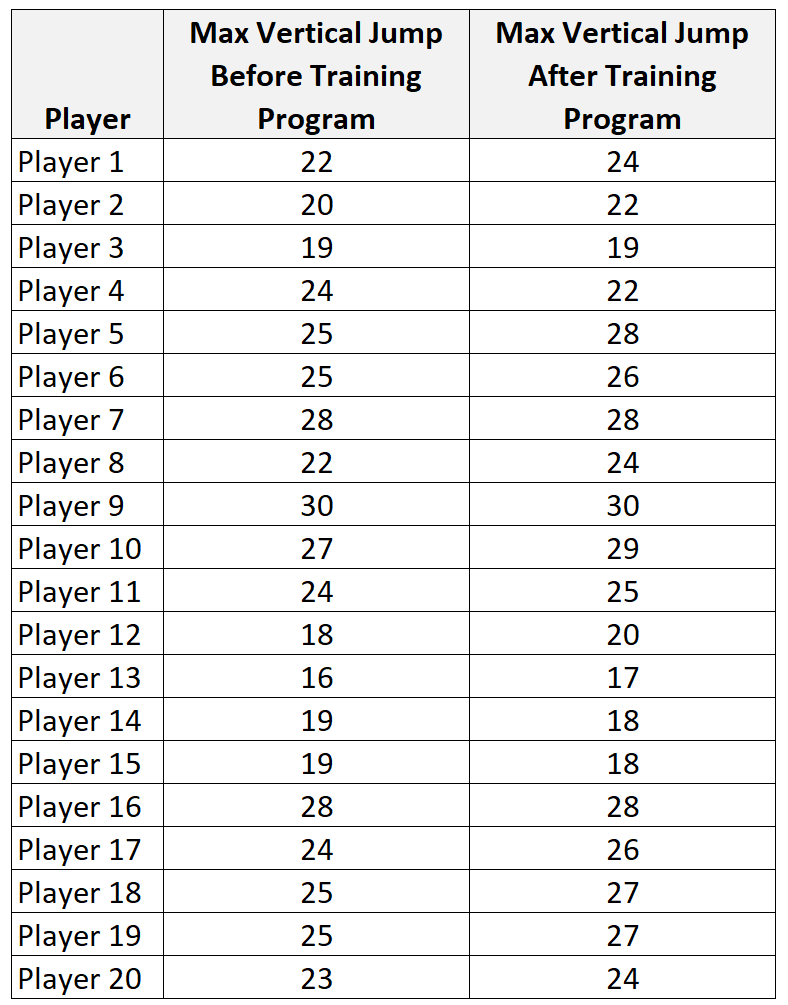
For example, suppose we want to know whether or not a certain training program is able to increase the max vertical jump of college basketball players.
To test this, we may recruit a simple random sample of 20 college basketball players and measure each of their max vertical jumps. Then, we may have each player use the training program for one month and then measure their max vertical jump again at the end of the month:
We can use the following steps to perform a paired samples t-test:
Step 1: State the Null and Alternative Hypotheses
We will perform the paired samples t-test with the following hypotheses:
- H0: μbefore = μafter (the two population means are equal)
- H1: μbefore ≠ μafter (the two population means are not equal)
2. Determine a significance level to use.
We will choose to use a significance level of 0.01.
3. Calculate the test statistic and p-value.
We can plug in the raw data for each sample into this Paired Samples t-test Calculator to calculate the test statistic and p-value:
- t test statistic: -3.226
- two-tailed p-value: 0.0045
4. Reject or fail to reject the null hypothesis.
Since the p-value (0.0045) is less than the significance level (0.01) we reject the null hypothesis.
We have sufficient evidence to say that the mean vertical jump before and after participating in the training program is not equal.
Bonus: Decision Rule Calculator
You can use this decision rule calculator to automatically determine whether you should reject or fail to reject a null hypothesis for a hypothesis test based on the value of the test statistic.