A one-way ANOVA is used to determine whether or not there is a statistically significant difference between the means of three or more independent groups.
The hypotheses used in an ANOVA are as follows:
The null hypothesis (H0): µ1 = µ2 = µ3 = … = µk (the means are equal for each group)
The alternative hypothesis: (Ha): at least one of the means is different from the others
If the p-value from the ANOVA is less than the significance level, we can reject the null hypothesis and conclude that we have sufficient evidence to say that at least one of the means of the groups is different from the others.
However, this doesn’t tell us which groups are different from each other. It simply tells us that not all of the group means are equal. In order to find out exactly which groups are different from each other, we must conduct a post hoc test.
The most commonly used post hoc test is the Tukey-Kramer test, which compares the mean between each pairwise combination of groups.
The following example shows how to perform the Tukey-Kramer test in Excel.
Example: Tukey-Kramer Test in Excel
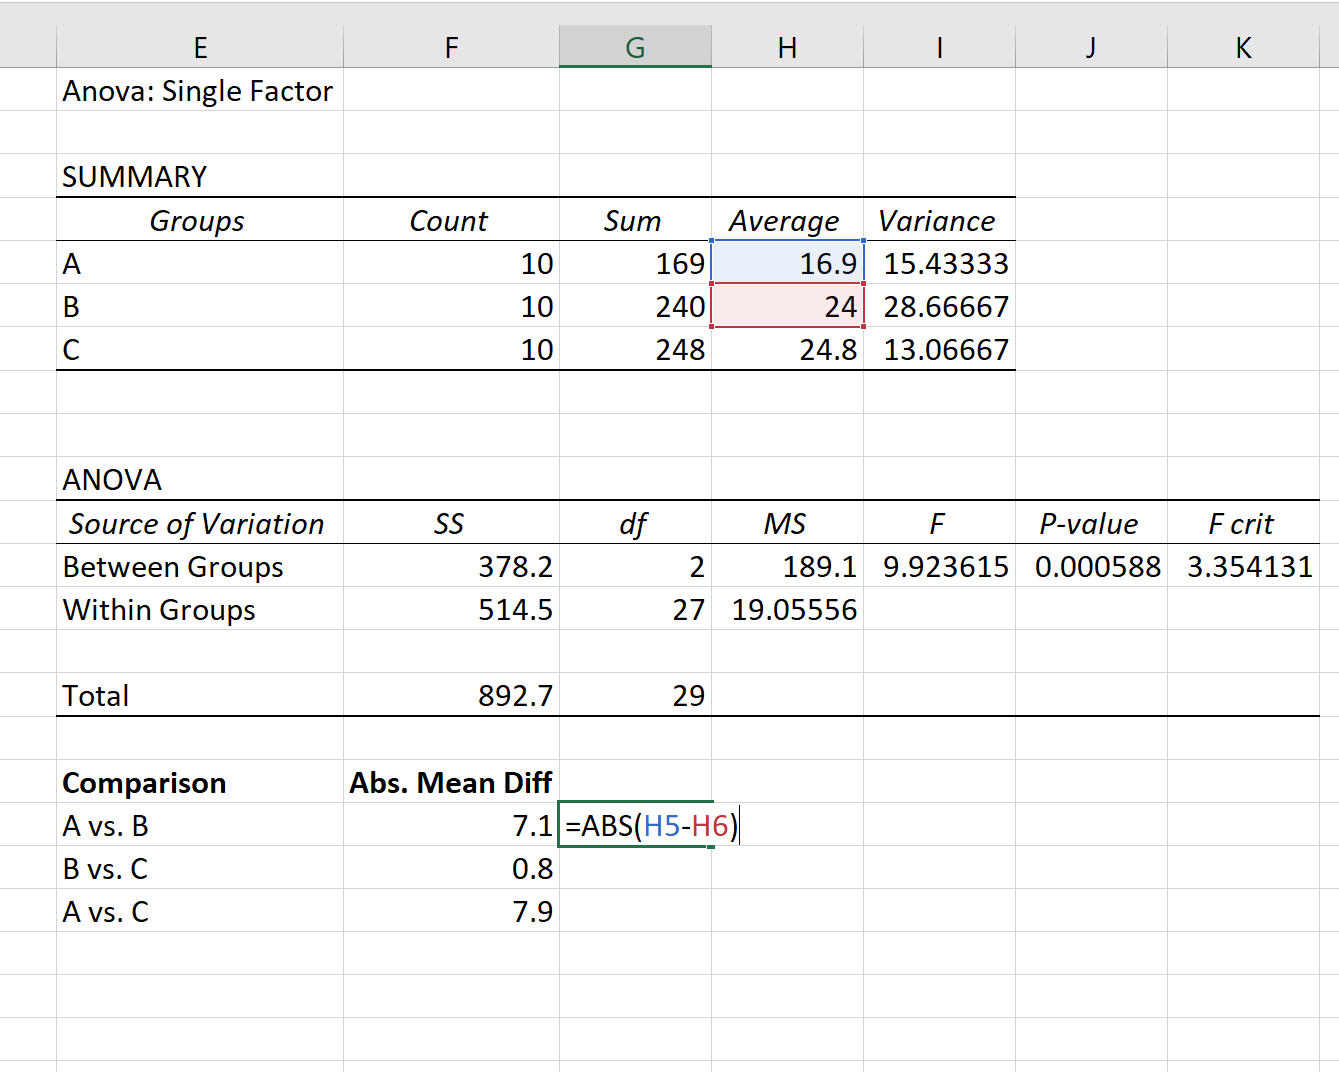
Suppose we perform a one-way ANOVA on three groups: A, B, and C. The results of the one-way ANOVA are shown below:
Related: How to Perform a One-Way ANOVA in Excel
The p-value from the ANOVA table is 0.000588. Since this p-value is less than .05, we can reject the null hypothesis and conclude that the means between the three groups are not equal.
To determine exactly which group means are different, we can perform a Tukey-Kramer post hoc test using the following steps:
Step 1: Find the absolute mean difference between each group.
First, we’ll find the absolute mean difference between each group using the averages listed in the first table of the ANOVA output:
Step 2: Find the Q critical value.
Next, we need to find the Q critical value using the following formula:
Q critical value = Q*√(s2pooled / n.)
where:
- Q = Value from Studentized Range Q Table
- s2pooled = Pooled variance across all groups
- n. = Sample size for a given group
To find the Q value, you can refer to the Studentized Range Q Table which looks like this:
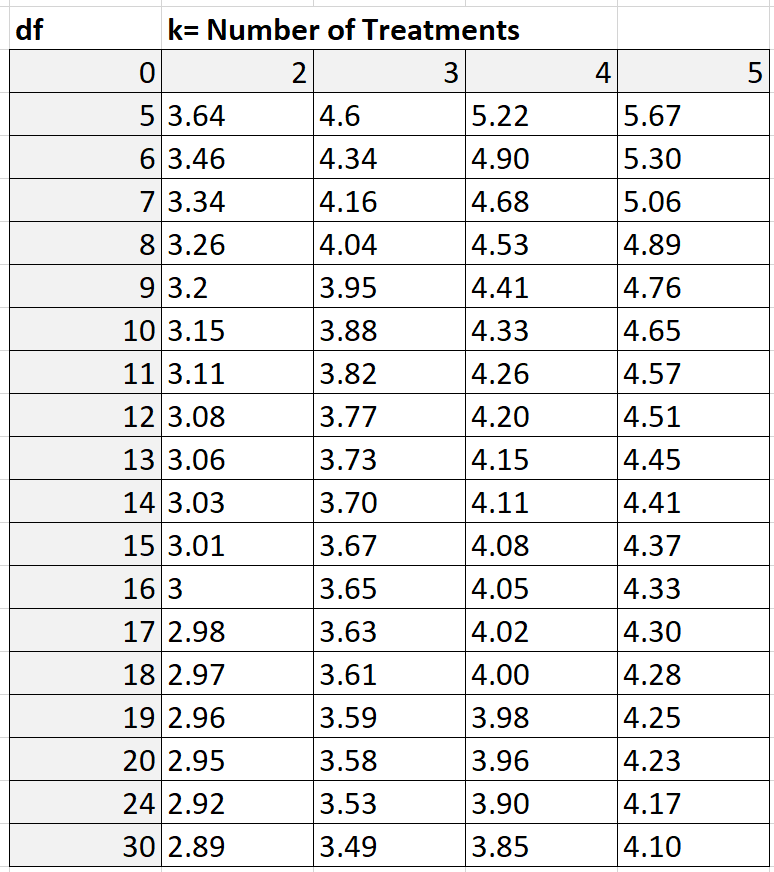
In our example, k = the number of groups, which is k = 3. The degrees of freedom is calculated as n-k = 30 – 3 = 27. Since 27 is not shown in the table above, we can use a conservative estimate of 24. Based on k = 3 and df = 24, we find that Q = 3.53.
The pooled variance can be calculated as the average of the variances for the groups, which turns out to be 19.056.

Lastly, the sample size of each group is 10.
Thus, our Q critical value can be calculated as:
Q critical value = Q*√(s2pooled / n.) = 3.53*√(19.056/10) = 4.87.
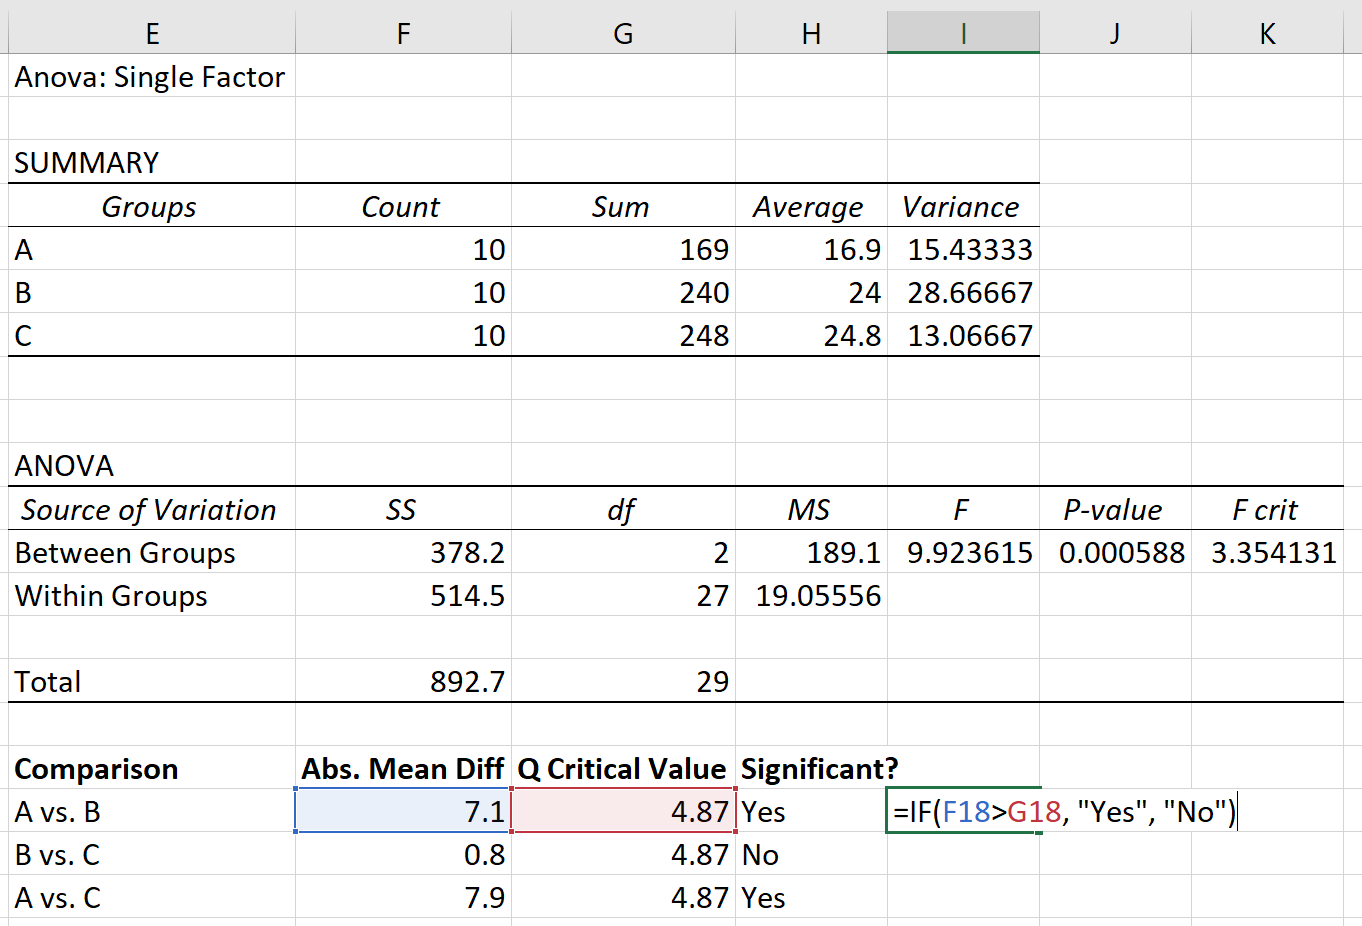
Step 3: Determine which group means are different.
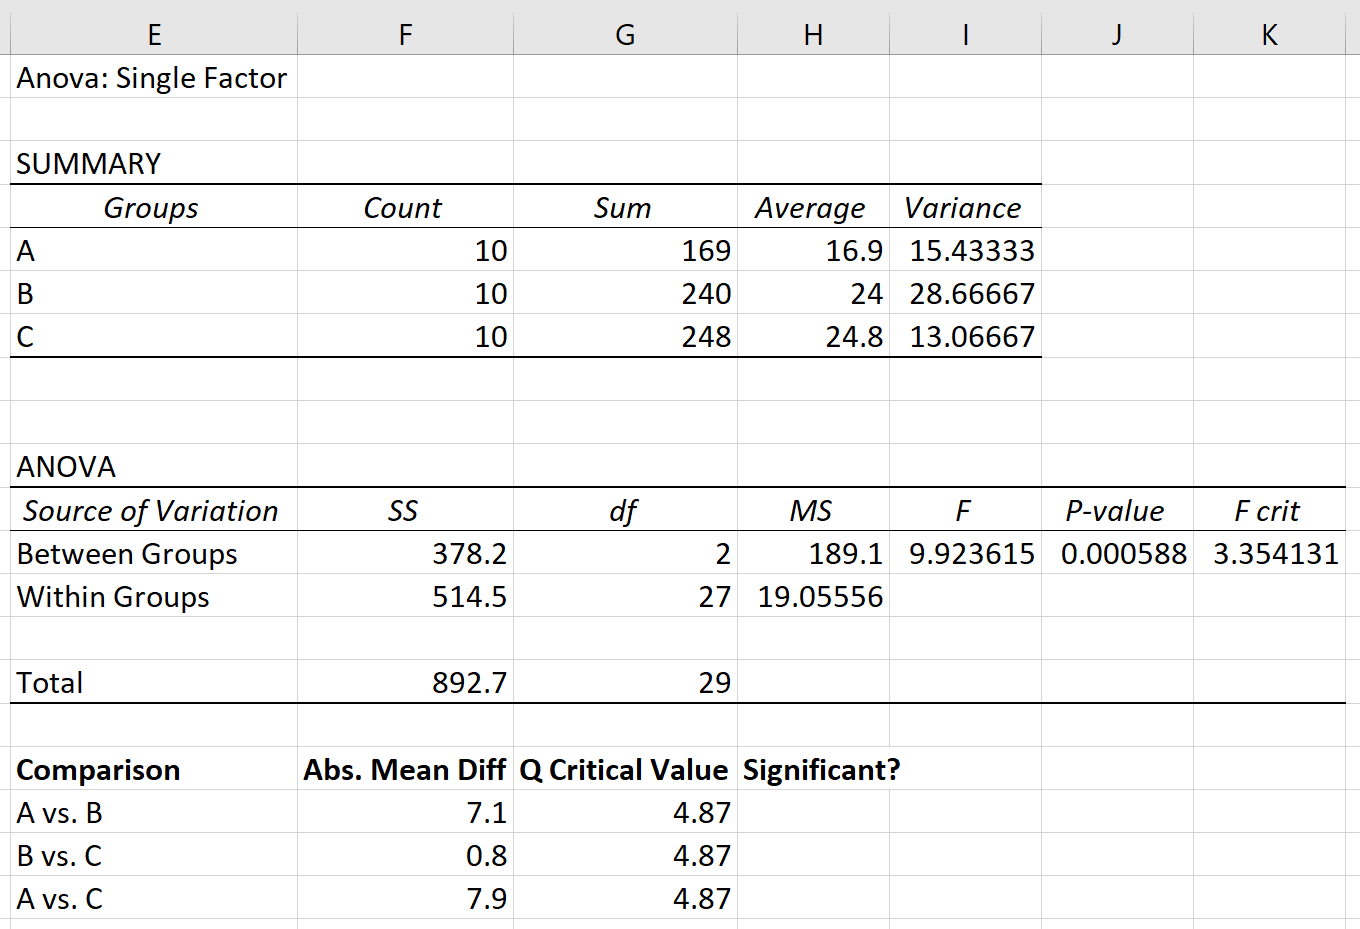
Lastly, we can compare the absolute mean difference between each group to the Q critical value. If the absolute mean difference is larger than the Q critical value, then the difference between the group means is statistically significant:
Based on the Tukey-Kramer post hoc test, we found the following:
- The difference in means between group A and group B is statistically significant.
- The difference in means between group B and group C is not statistically significant.
- The difference in means between group A and group C is statistically significant.
Additional Resources
How to Perform a One-Way ANOVA in Excel
A Guide to Using Post Hoc Tests with ANOVA