A one-way ANOVA (“analysis of variance”) compares the means of three or more independent groups to determine if there is a statistically significant difference between the corresponding population means.
This tutorial explains the following:
- The motivation for performing a one-way ANOVA.
- The assumptions that should be met to perform a one-way ANOVA.
- The process to perform a one-way ANOVA.
- An example of how to perform a one-way ANOVA.
One-Way ANOVA: Motivation
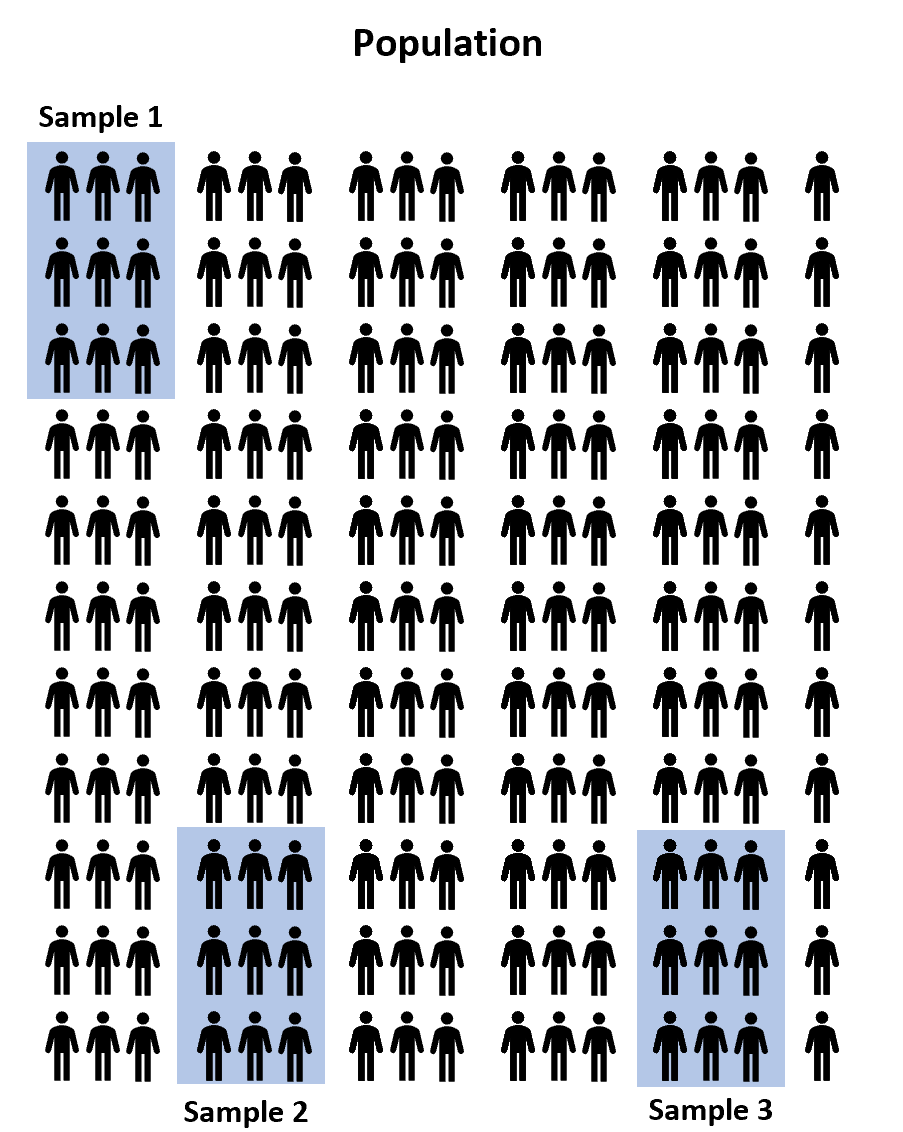
Suppose we want to know whether or not three different exam prep programs lead to different mean scores on a college entrance exam. Since there are millions of high school students around the country, it would be too time-consuming and costly to go around to each student and let them use one of the exam prep programs.
Instead, we might select three random samples of 100 students from the population and allow each sample to use one of the three test prep programs to prepare for the exam. Then, we could record the scores for each student once they take the exam.
However, it’s virtually guaranteed that the mean exam score between the three samples will be at least a little different. The question is whether or not this difference is statistically significant. Fortunately, a one-way ANOVA allows us to answer this question.
One-Way ANOVA: Assumptions
For the results of a one-way ANOVA to be valid, the following assumptions should be met:
1. Normality – Each sample was drawn from a normally distributed population.
2. Equal Variances – The variances of the populations that the samples come from are equal. You can use Bartlett’s Test to verify this assumption.
3. Independence – The observations in each group are independent of each other and the observations within groups were obtained by a random sample.
Read this article for in-depth details on how to check these assumptions.
One-Way ANOVA: The Process
A one-way ANOVA uses the following null and alternative hypotheses:
- H0 (null hypothesis): μ1 = μ2 = μ3 = … = μk (all the population means are equal)
- H1 (alternative hypothesis): at least one population mean is different from the rest
You will typically use some statistical software (such as R, Excel, Stata, SPSS, etc.) to perform a one-way ANOVA since it’s cumbersome to perform by hand.
No matter which software you use, you will receive the following table as output:
| Source | Sum of Squares (SS) | df | Mean Squares (MS) | F | p |
|---|---|---|---|---|---|
| Treatment | SSR | dfr | MSR | MSR/MSE | Fdfr, dfe |
| Error | SSE | dfe | MSE | ||
| Total | SST | dft |
where:
- SSR: regression sum of squares
- SSE: error sum of squares
- SST: total sum of squares (SST = SSR + SSE)
- dfr: regression degrees of freedom (dfr = k-1)
- dfe: error degrees of freedom (dfe = n-k)
- dft: total degrees of freedom (dft = n-1)
- k: total number of groups
- n: total observations
- MSR: regression mean square (MSR = SSR/dfr)
- MSE: error mean square (MSE = SSE/dfe)
- F: The F test statistic (F = MSR/MSE)
- p: The p-value that corresponds to Fdfr, dfe
If the p-value is less than your chosen significance level (e.g. 0.05), then you can reject the null hypothesis and conclude that at least one of the population means is different from the others.
Note: If you reject the null hypothesis, this indicates that at least one of the population means is different from the others, but the ANOVA table doesn’t specify which population means are different. To determine this, you need to perform post hoc tests, also known as “multiple comparisons” tests.
One-Way ANOVA: Example
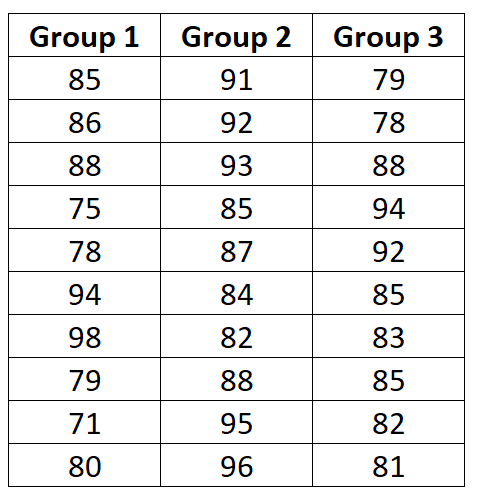
Suppose we want to know whether or not three different exam prep programs lead to different mean scores on a certain exam. To test this, we recruit 30 students to participate in a study and split them into three groups.
The students in each group are randomly assigned to use one of the three exam prep programs for the next three weeks to prepare for an exam. At the end of the three weeks, all of the students take the same exam.
The exam scores for each group are shown below:
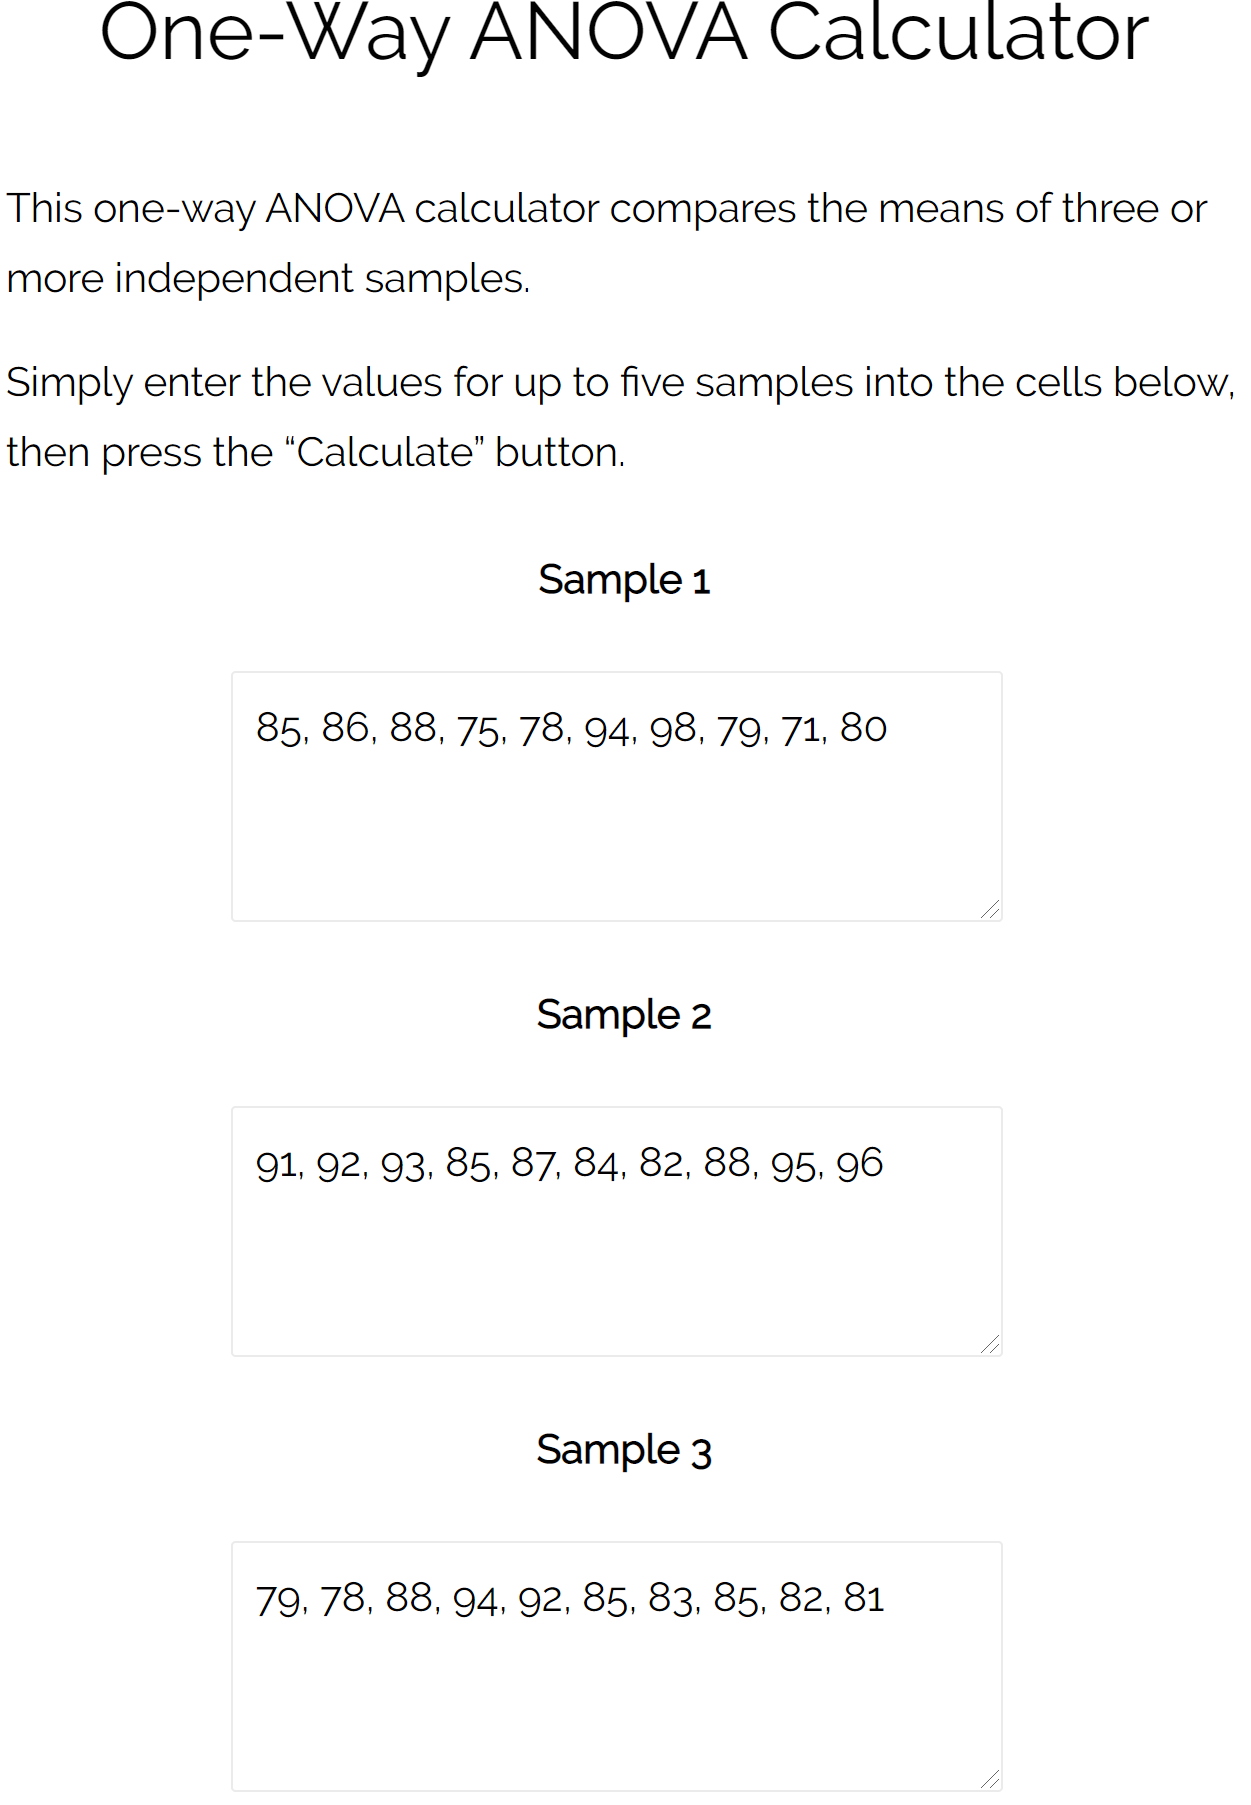
To perform a one-way ANOVA on this data, we will use the Statology One-Way ANOVA Calculator with the following input:
From the output table we see that the F test statistic is 2.358 and the corresponding p-value is 0.11385.
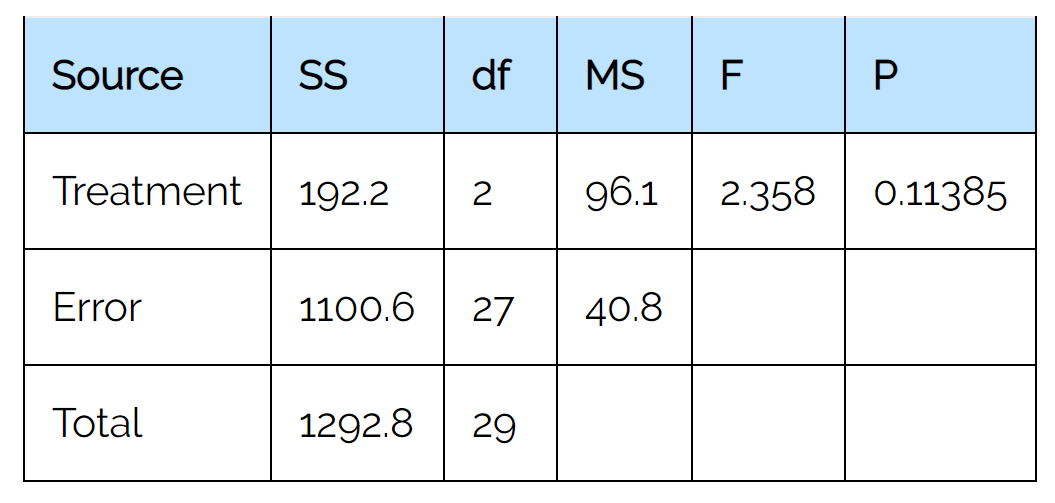
Since this p-value is not less than 0.05, we fail to reject the null hypothesis.
This means we don’t have sufficient evidence to say that there is a statistically significant difference between the mean exam scores of the three groups.
Additional Resources
The following articles explain how to perform a one-way ANOVA using different statistical softwares:
How to Perform a One-Way ANOVA in Excel
How to Perform a One-Way ANOVA in R
How to Perform a One-Way ANOVA in Python
How to Perform a One-Way ANOVA in SAS
How to Perform a One-Way ANOVA in SPSS
How to Perform a One-Way ANOVA in Stata
How to Perform a One-Way ANOVA on a TI-84 Calculator
Online One-Way ANOVA Calculator