We often use three different sum of squares values to measure how well a regression line actually fits a dataset:
1. Sum of Squares Total (SST) – The sum of squared differences between individual data points (yi) and the mean of the response variable (y).
- SST = Σ(yi – y)2
2. Sum of Squares Regression (SSR) – The sum of squared differences between predicted data points (ŷi) and the mean of the response variable(y).
- SSR = Σ(ŷi – y)2
3. Sum of Squares Error (SSE) – The sum of squared differences between predicted data points (ŷi) and observed data points (yi).
- SSE = Σ(ŷi – yi)2
The following step-by-step example shows how to calculate each of these metrics for a given regression model in Excel.
Step 1: Create the Data
First, let’s create a dataset that contains the number of hours studied and exam score received for 20 different students at a certain school:

Step 2: Fit a Regression Model
Along the top ribbon in Excel, click the Data tab and click on Data Analysis. If you don’t see this option, then you need to first install the free Analysis ToolPak.
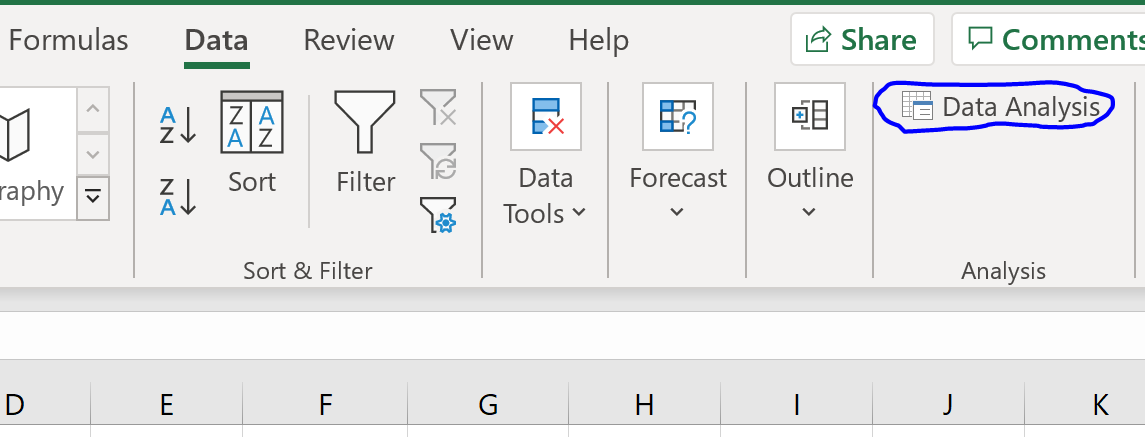
Once you click on Data Analysis, a new window will pop up. Select Regression and click OK.
In the new window that appears, fill in the following information:

Once you click OK, the regression output will appear.

Step 3: Analyze the Output
The three sum of squares metrics – SST, SSR, and SSE – can be seen in the SS column of the ANOVA table:
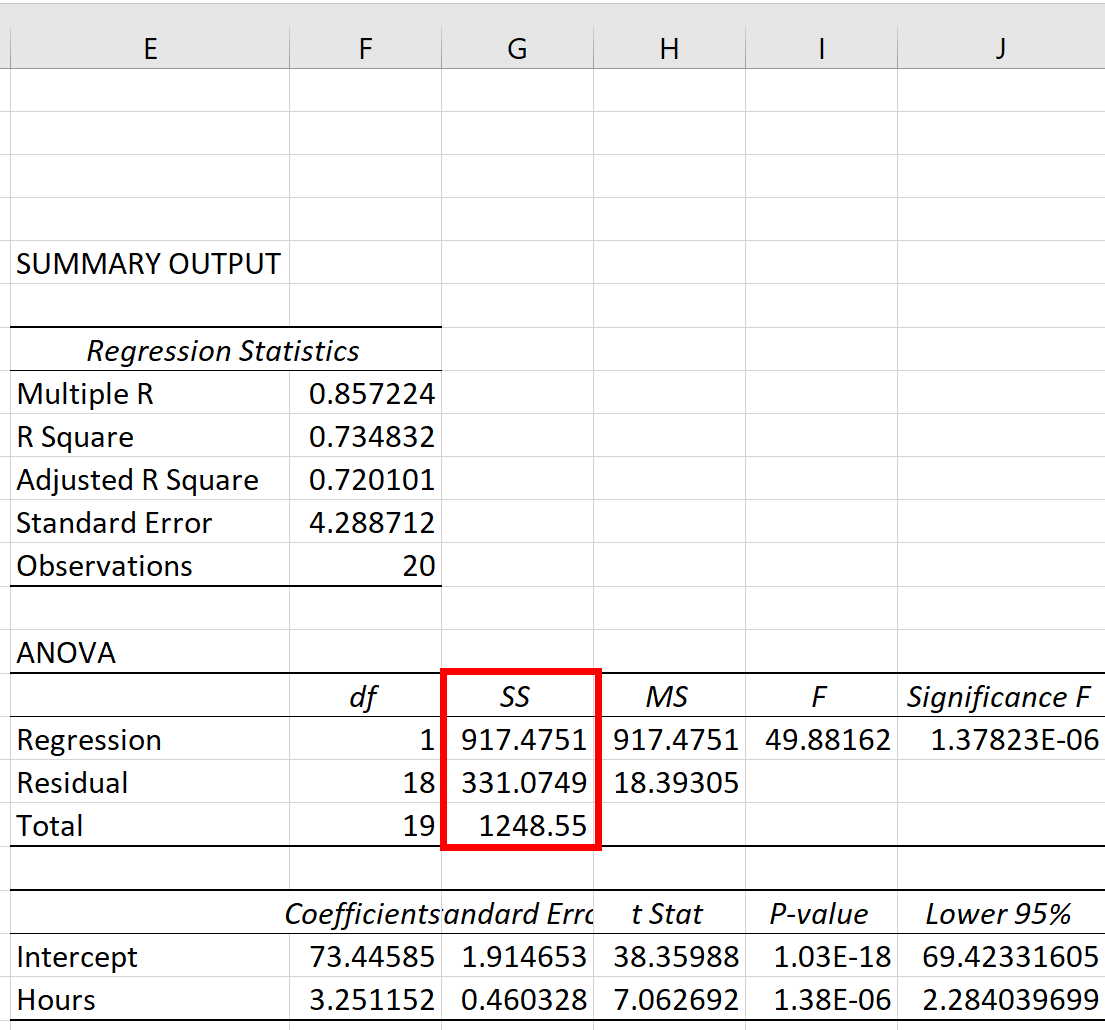
The metrics turn out to be:
- Sum of Squares Total (SST): 1248.55
- Sum of Squares Regression (SSR): 917.4751
- Sum of Squares Error (SSE): 331.0749
We can verify that SST = SSR + SSE:
- SST = SSR + SSE
- 1248.55 = 917.4751 + 331.0749
We can also manually calculate the R-squared of the regression model:
- R-squared = SSR / SST
- R-squared = 917.4751 / 1248.55
- R-squared = 0.7348
This tells us that 73.48% of the variation in exam scores can be explained by the number of hours studied.
Additional Resources
How to Perform Simple Linear Regression in Excel
How to Perform Multiple Linear Regression in Excel
How to Perform Polynomial Regression in Excel
How to Perform Exponential Regression in Excel