Regression analysis is used to quantify the relationship between one or more explanatory variables and a response variable.
The most common type of regression analysis is simple linear regression, which is used when an explanatory variable and a response variable have a linear relationship.
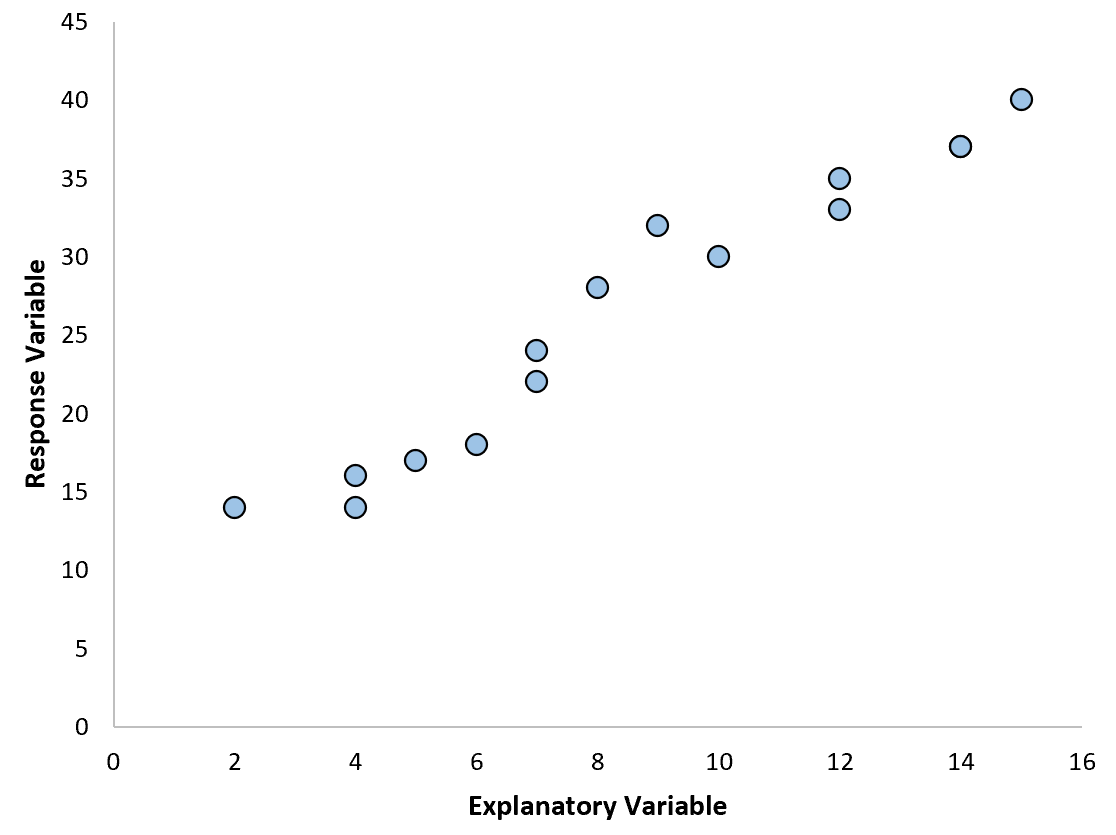
However, sometimes the relationship between an explanatory variable and a response variable is nonlinear.
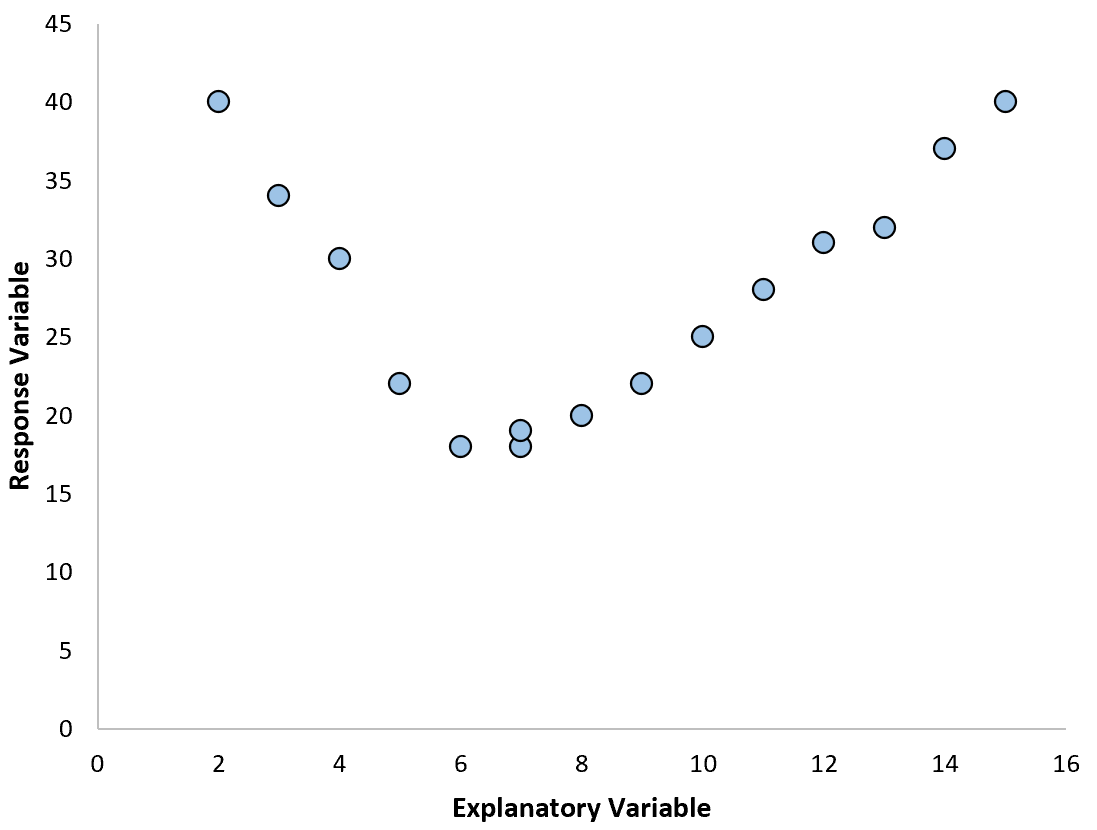
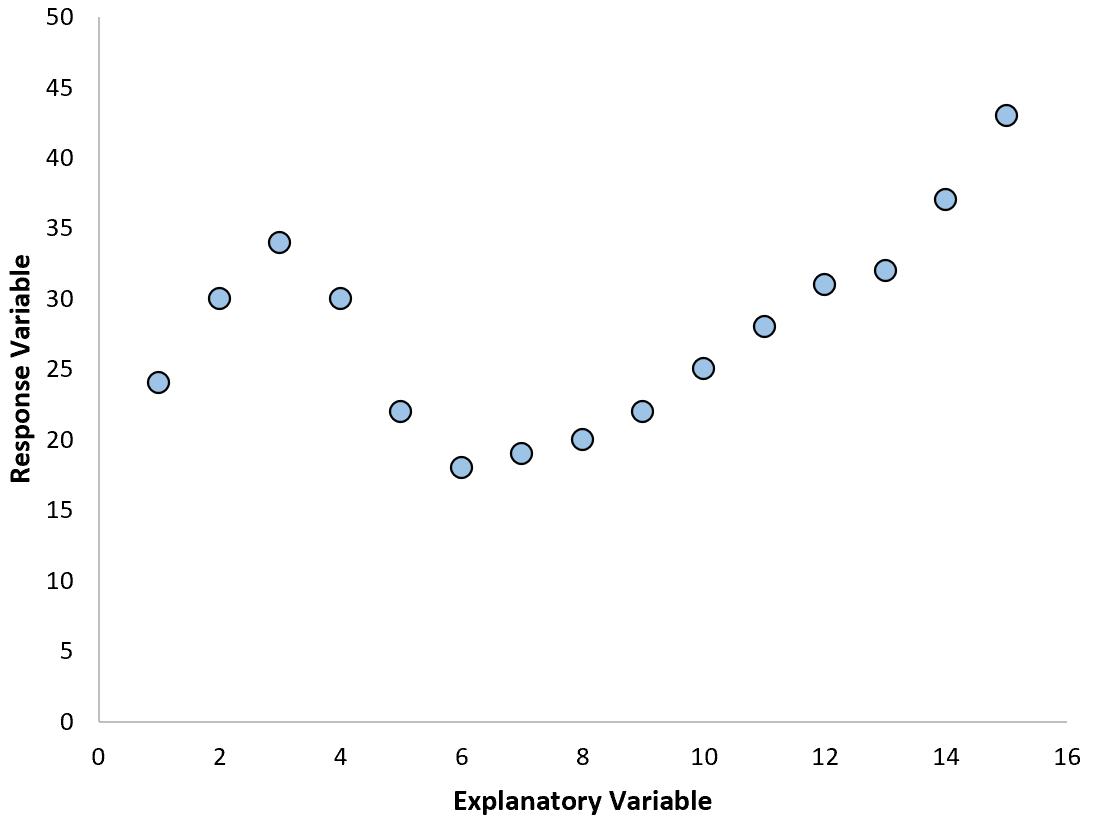
In these cases it makes sense to use polynomial regression, which can account for the nonlinear relationship between the variables.
This tutorial explains how to perform polynomial regression in Excel.
Example: Polynomial Regression in Excel
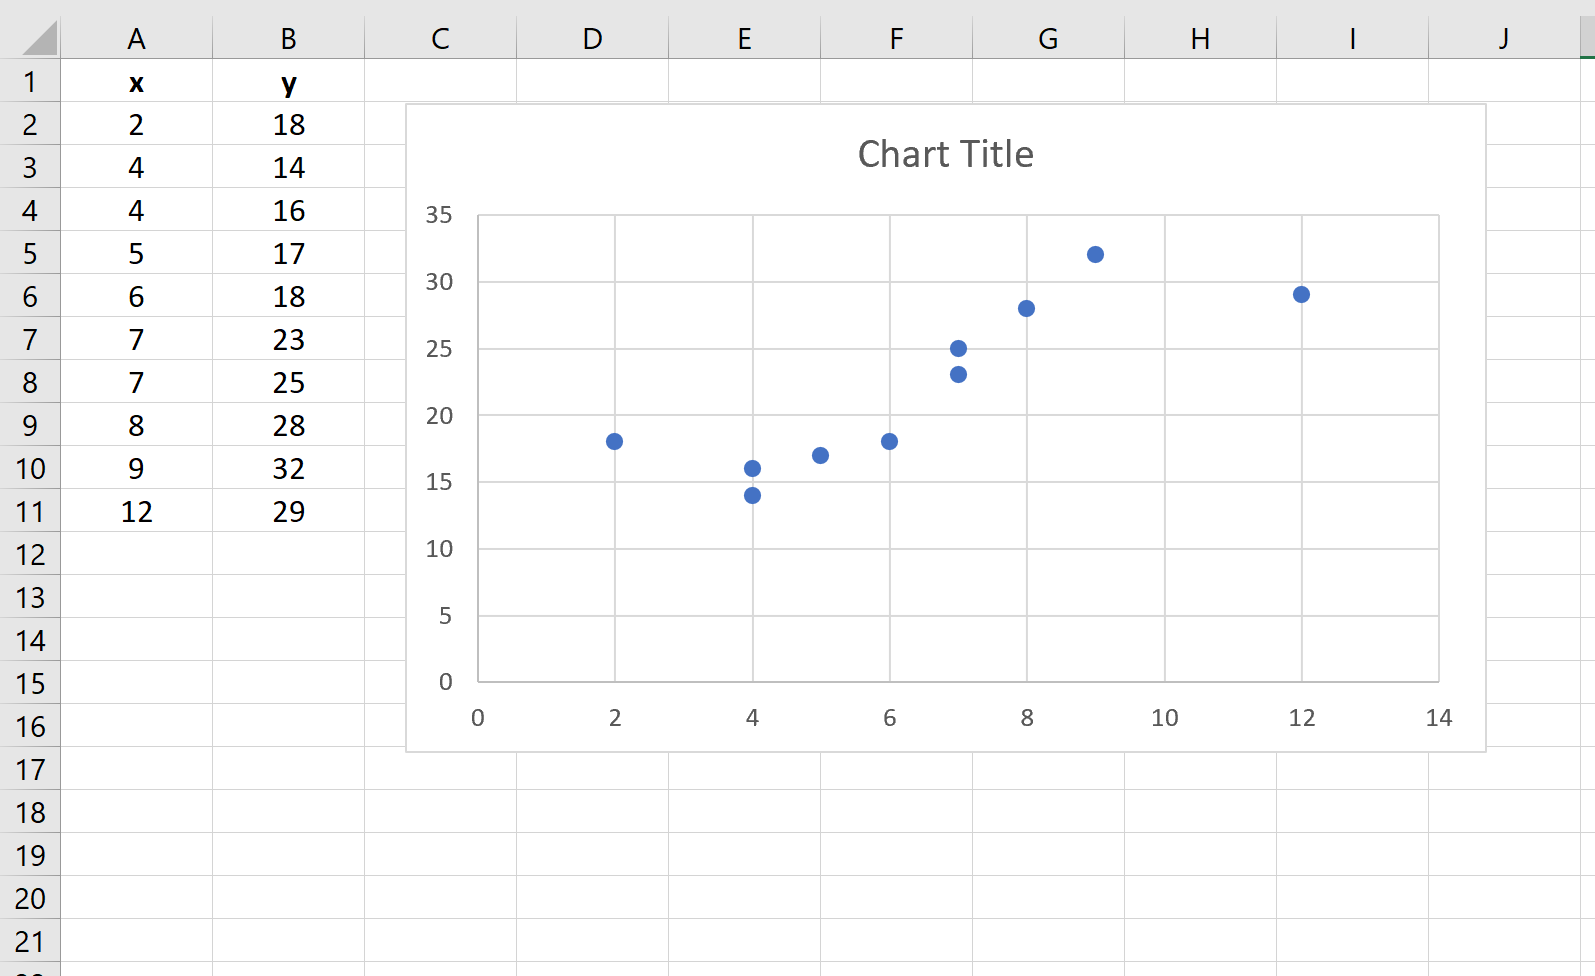
Suppose we have the following dataset in Excel:
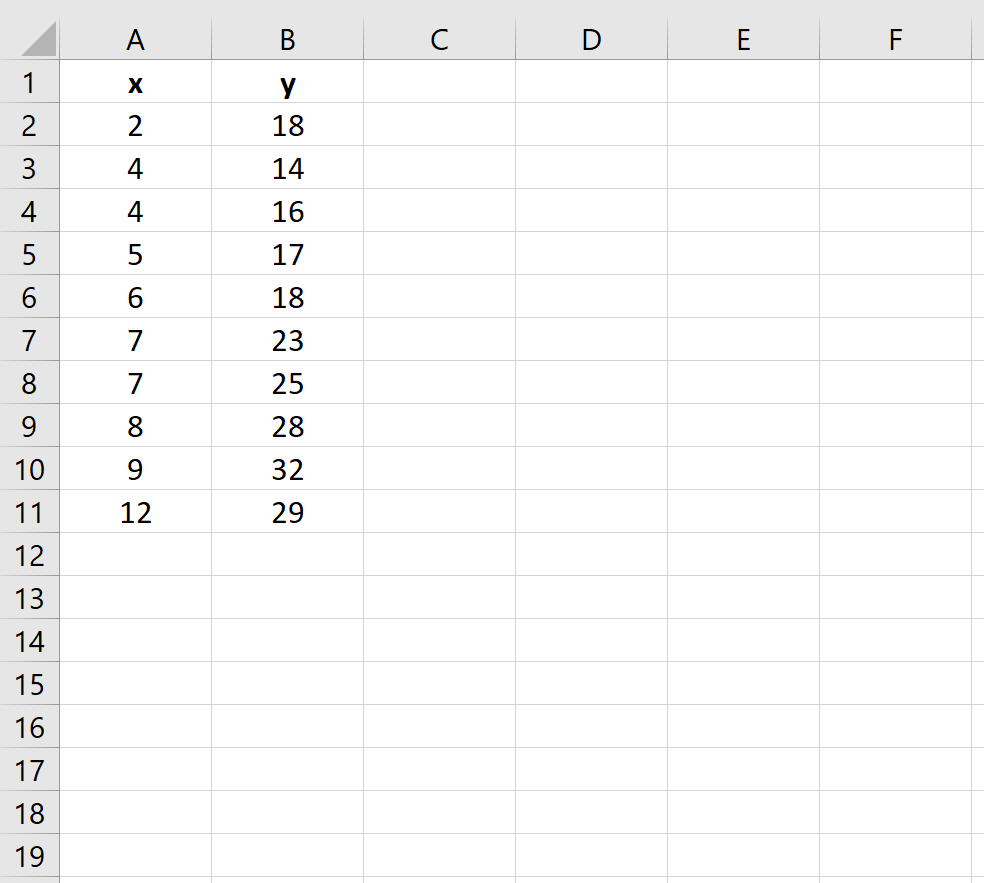
Use the following steps to fit a polynomial regression equation to this dataset:
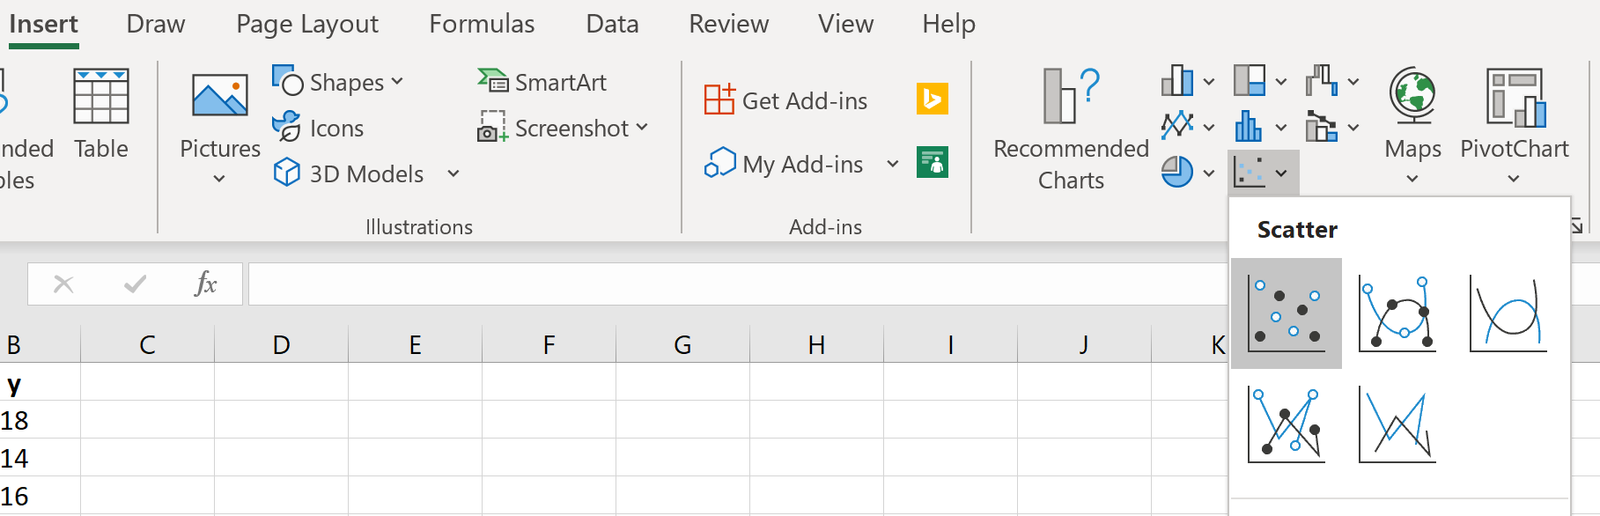
Step 1: Create a scatterplot.
First, we need to create a scatterplot. Go to the Charts group in the Insert tab and click the first chart type in Scatter:
A scatterplot will automatically appear:
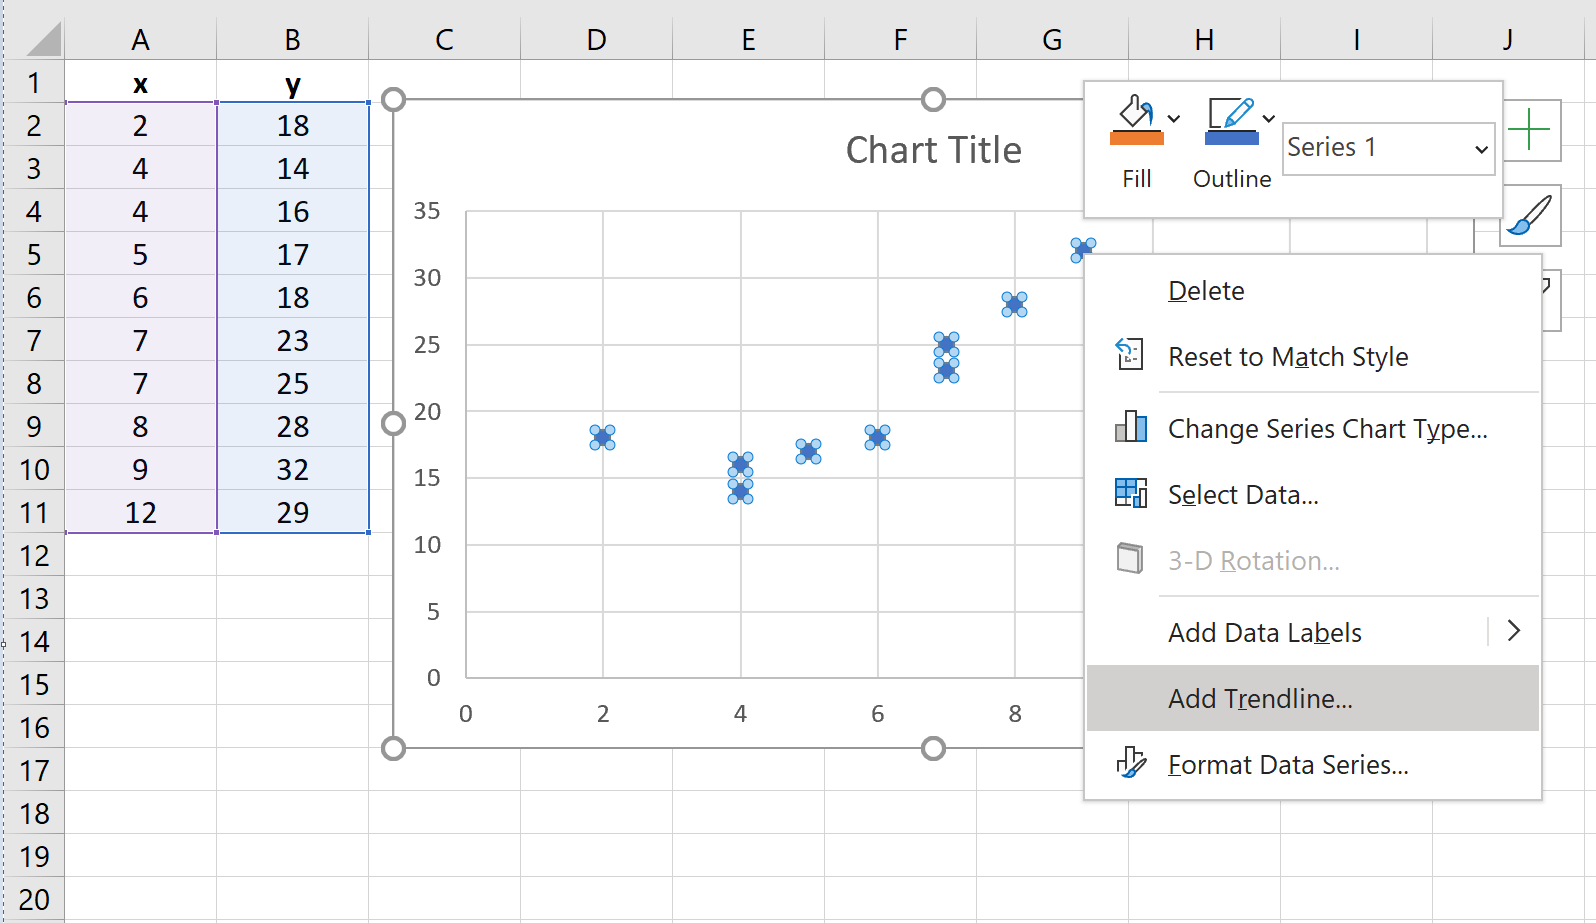
Step 2: Add a trendline.
Next, we need to add a trendline to the scatterplot. To do so, click on any of the individual points in the scatterplot. Then, right click and select Add Trendline…
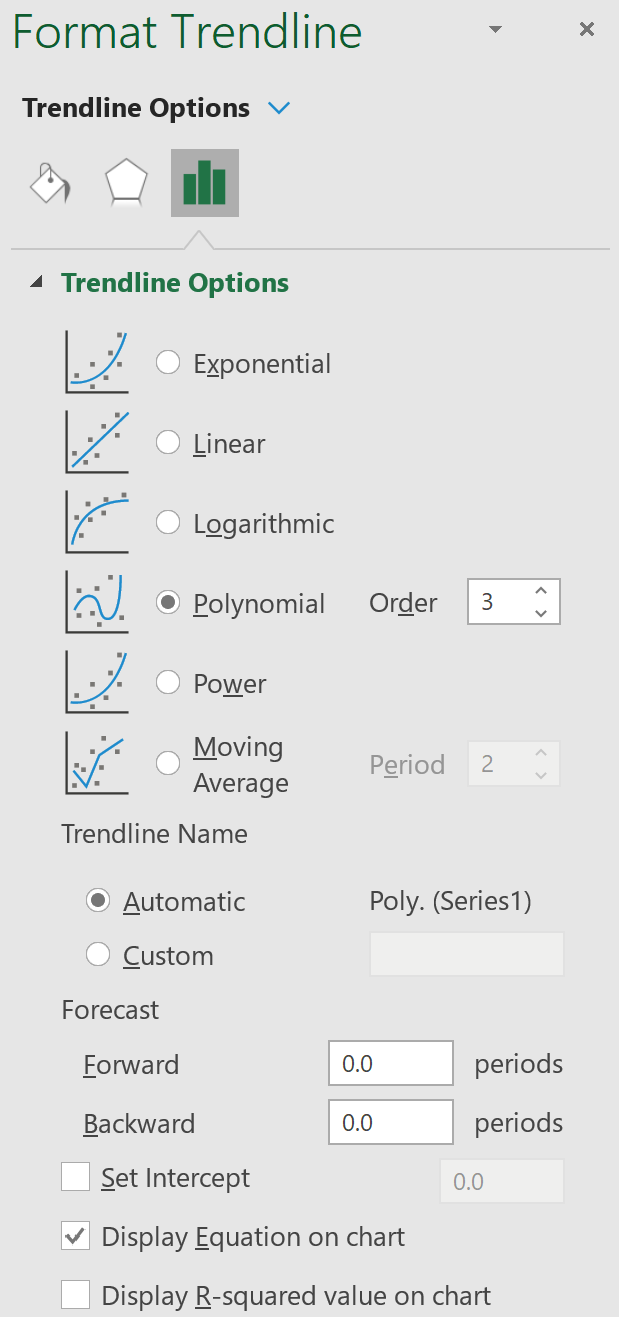
A new window will pop up with the option to specify a trendline. Choose Polynomial and choose the number you’d like to use for Order. We will use 3. Then, check the box near the bottom that says Display Equation on chart.
A trendline with a polynomial regression equation will automatically appear on the scatterplot:
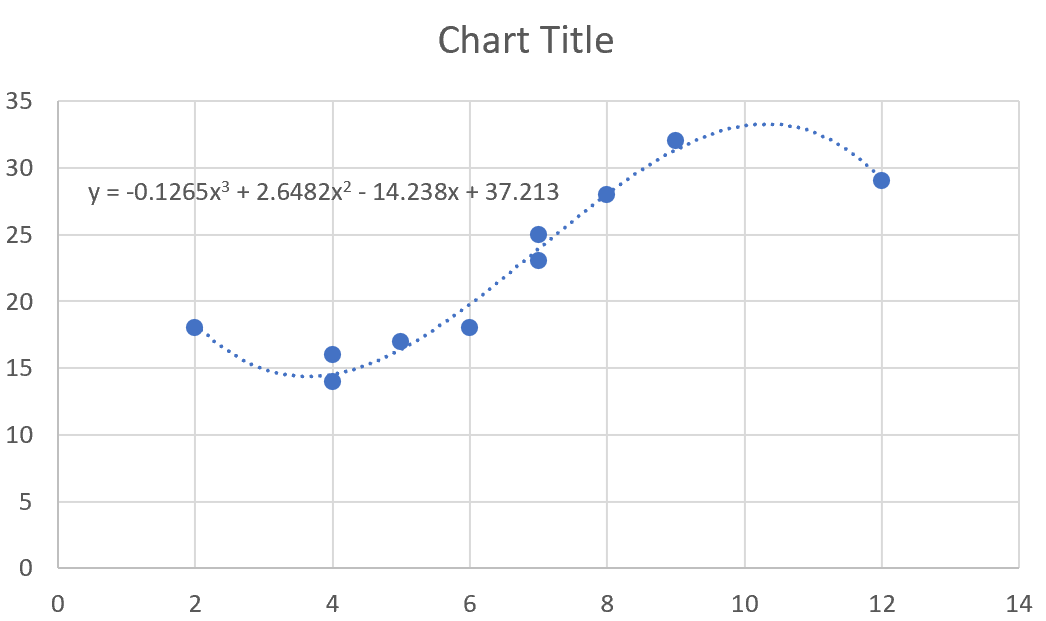
Step 3: Interpret the regression equation.
For this particular example, our fitted polynomial regression equation is:
y = -0.1265x3 + 2.6482x2 – 14.238x + 37.213
This equation can be used to find the expected value for the response variable based on a given value for the explanatory variable. For example, suppose x = 4. The expected value for the response variable, y, would be:
y = -0.1265(4)3 + 2.6482(4)2 – 14.238(4) + 37.213 = 14.5362.