A one-way ANOVA is used to determine if there is a statistically significant difference between the mean of three or more independent groups.
A one-way ANOVA uses the following null and alternative hypotheses:
- H0: μ1 = μ2 = μ3 = … = μk (all of the group means are equal)
- HA: At least one group mean is different from the rest
To decide if we should reject or fail to reject the null hypothesis, we must refer to the p-value in the output of the ANOVA table.
If the p-value is less than some significance level (e.g. 0.05) then we can reject the null hypothesis and conclude that not all group means are equal.
A two-way ANOVA is used to determine whether or not there is a statistically significant difference between the means of three or more independent groups that have been split on two variables (sometimes called “factors”).
A two-way ANOVA tests three null hypotheses at the same time:
- All group means are equal at each level of the first variable
- All group means are equal at each level of the second variable
- There is no interaction effect between the two variables
To decide if we should reject or fail to reject each null hypothesis, we must refer to the p-values in the output of the two-way ANOVA table.
The following examples show how to decide to reject or fail to reject the null hypothesis in both a one-way ANOVA and two-way ANOVA.
Example 1: One-Way ANOVA
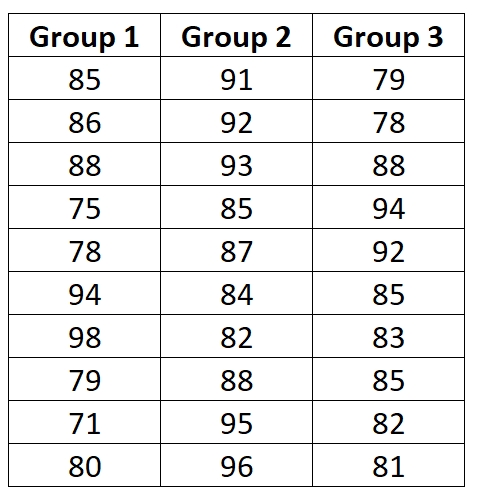
Suppose we want to know whether or not three different exam prep programs lead to different mean scores on a certain exam. To test this, we recruit 30 students to participate in a study and split them into three groups.
The students in each group are randomly assigned to use one of the three exam prep programs for the next three weeks to prepare for an exam. At the end of the three weeks, all of the students take the same exam.
The exam scores for each group are shown below:
When we enter these values into the One-Way ANOVA Calculator, we receive the following ANOVA table as the output:
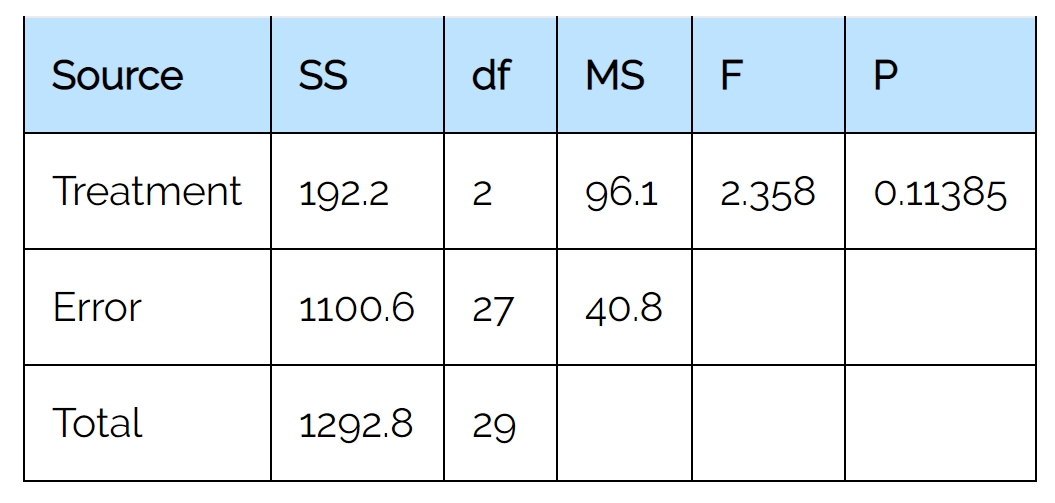
Notice that the p-value is 0.11385.
For this particular example, we would use the following null and alternative hypotheses:
- H0: μ1 = μ2 = μ3 (the mean exam score for each group is equal)
- HA: At least one group mean is different from the rest
Since the p-value from the ANOVA table is not less than 0.05, we fail to reject the null hypothesis.
This means we don’t have sufficient evidence to say that there is a statistically significant difference between the mean exam scores of the three groups.
Example 2: Two-Way ANOVA
Suppose a botanist wants to know whether or not plant growth is influenced by sunlight exposure and watering frequency.
She plants 40 seeds and lets them grow for two months under different conditions for sunlight exposure and watering frequency. After two months, she records the height of each plant. The results are shown below:
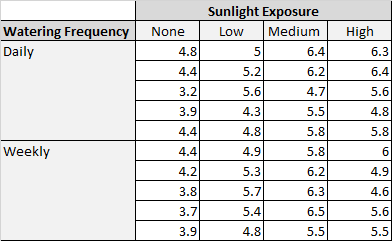
In the table above, we see that there were five plants grown under each combination of conditions.
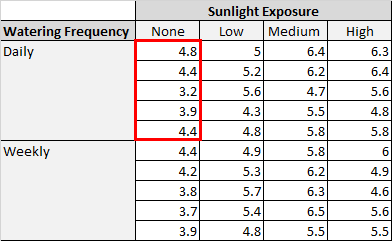
For example, there were five plants grown with daily watering and no sunlight and their heights after two months were 4.8 inches, 4.4 inches, 3.2 inches, 3.9 inches, and 4.4 inches:
She performs a two-way ANOVA in Excel and ends up with the following output:
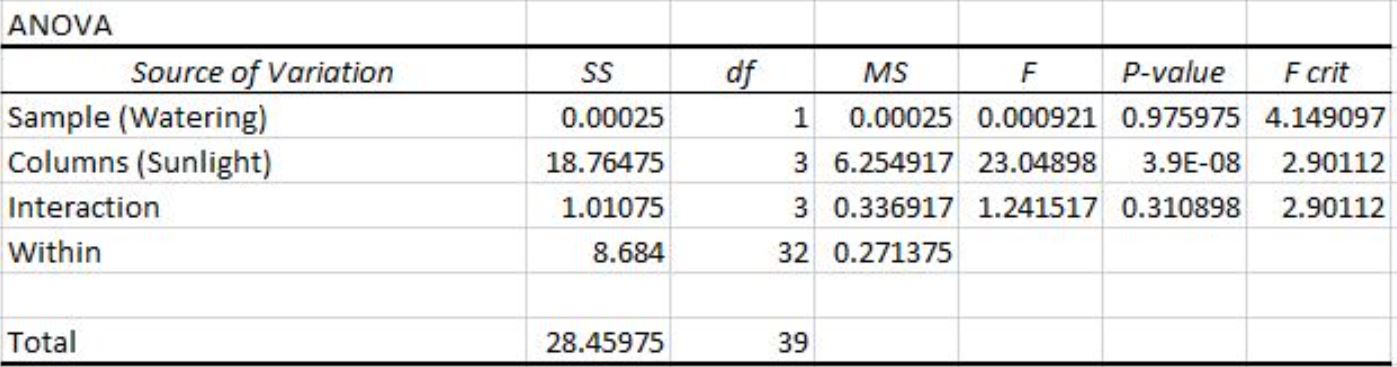
We can see the following p-values in the output of the two-way ANOVA table:
- The p-value for watering frequency is 0.975975. This is not statistically significant at a significance level of 0.05.
- The p-value for sunlight exposure is 3.9E-8 (0.000000039). This is statistically significant at a significance level of 0.05.
- The p-value for the interaction between watering frequency and sunlight exposure is 0.310898. This is not statistically significant at a significance level of 0.05.
These results indicate that sunlight exposure is the only factor that has a statistically significant effect on plant height.
And because there is no interaction effect, the effect of sunlight exposure is consistent across each level of watering frequency.
That is, whether a plant is watered daily or weekly has no impact on how sunlight exposure affects a plant.
Additional Resources
The following tutorials provide additional information about ANOVA models:
How to Interpret the F-Value and P-Value in ANOVA
How to Calculate Sum of Squares in ANOVA
What Does a High F Value Mean in ANOVA?