A two sample t-test is used to test whether or not the means of two populations are equal.
This tutorial provides a complete guide on how to interpret the results of a two sample t-test in Excel.
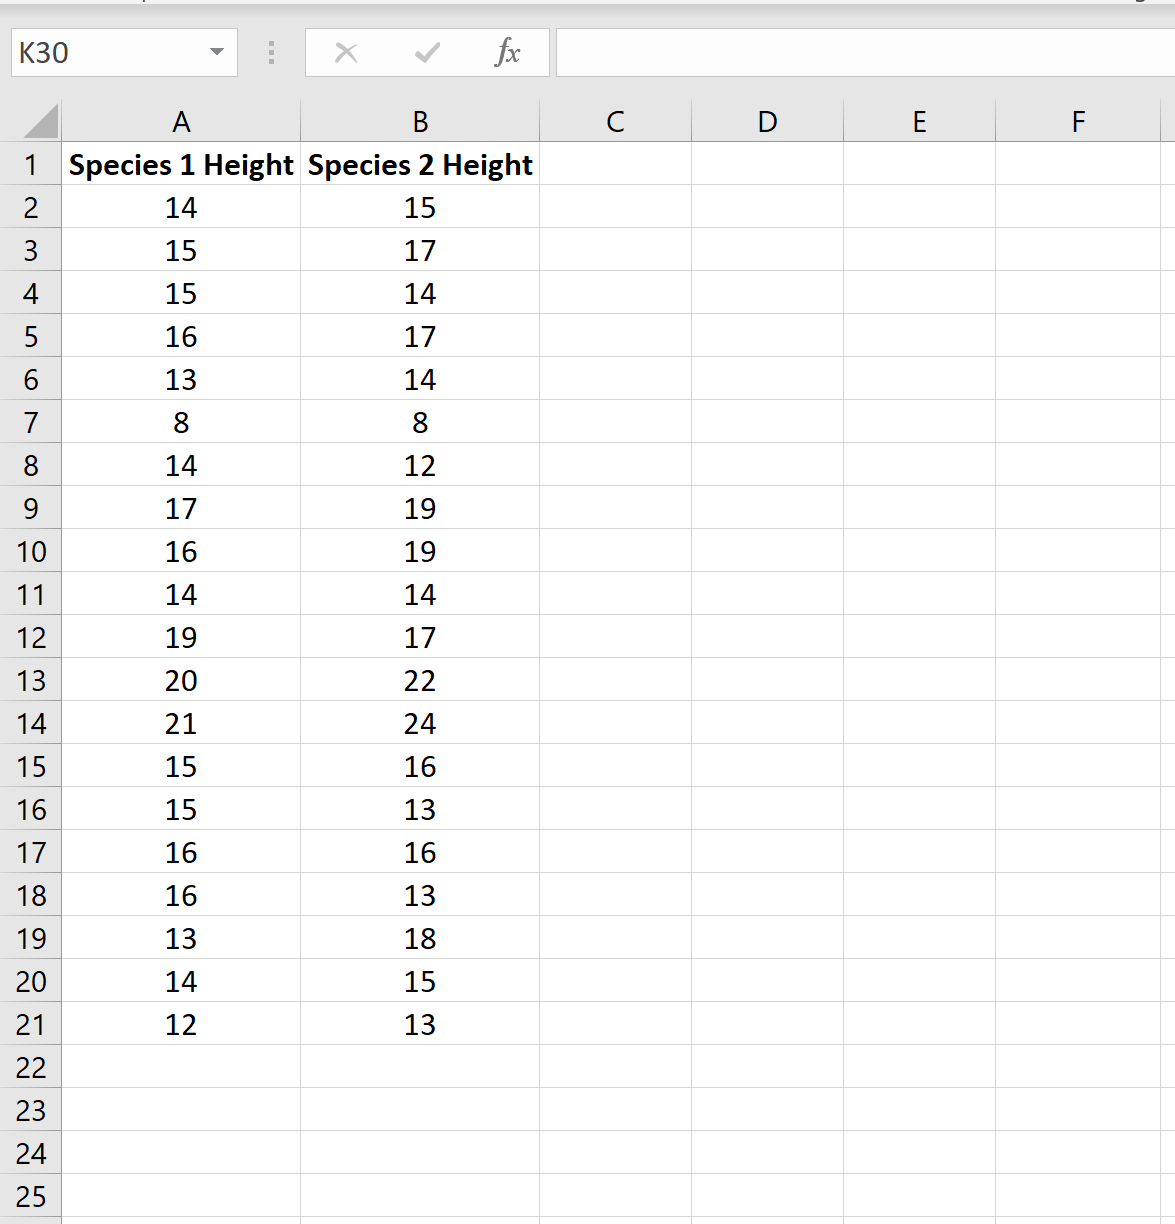
Step 1: Create the Data
Suppose a biologist want to know whether or not two different species of plants have the same mean height.
To test this, she collects a simple random sample of 20 plants from each species:
Step 2: Perform the Two Sample t-test
To perform a two sample t-test in Excel, click the Data tab along the top ribbon and then click Data Analysis:
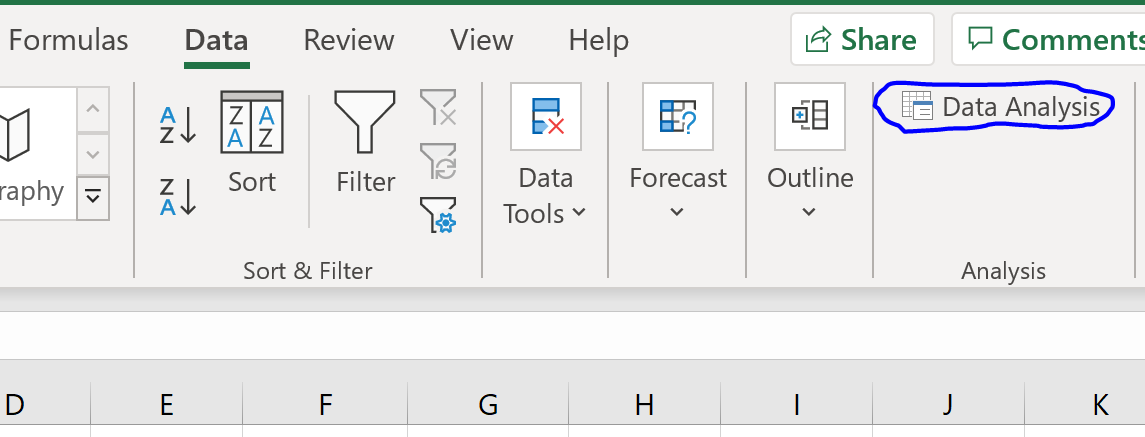
If you don’t see this option to click on, you need to first download the Analysis ToolPak.
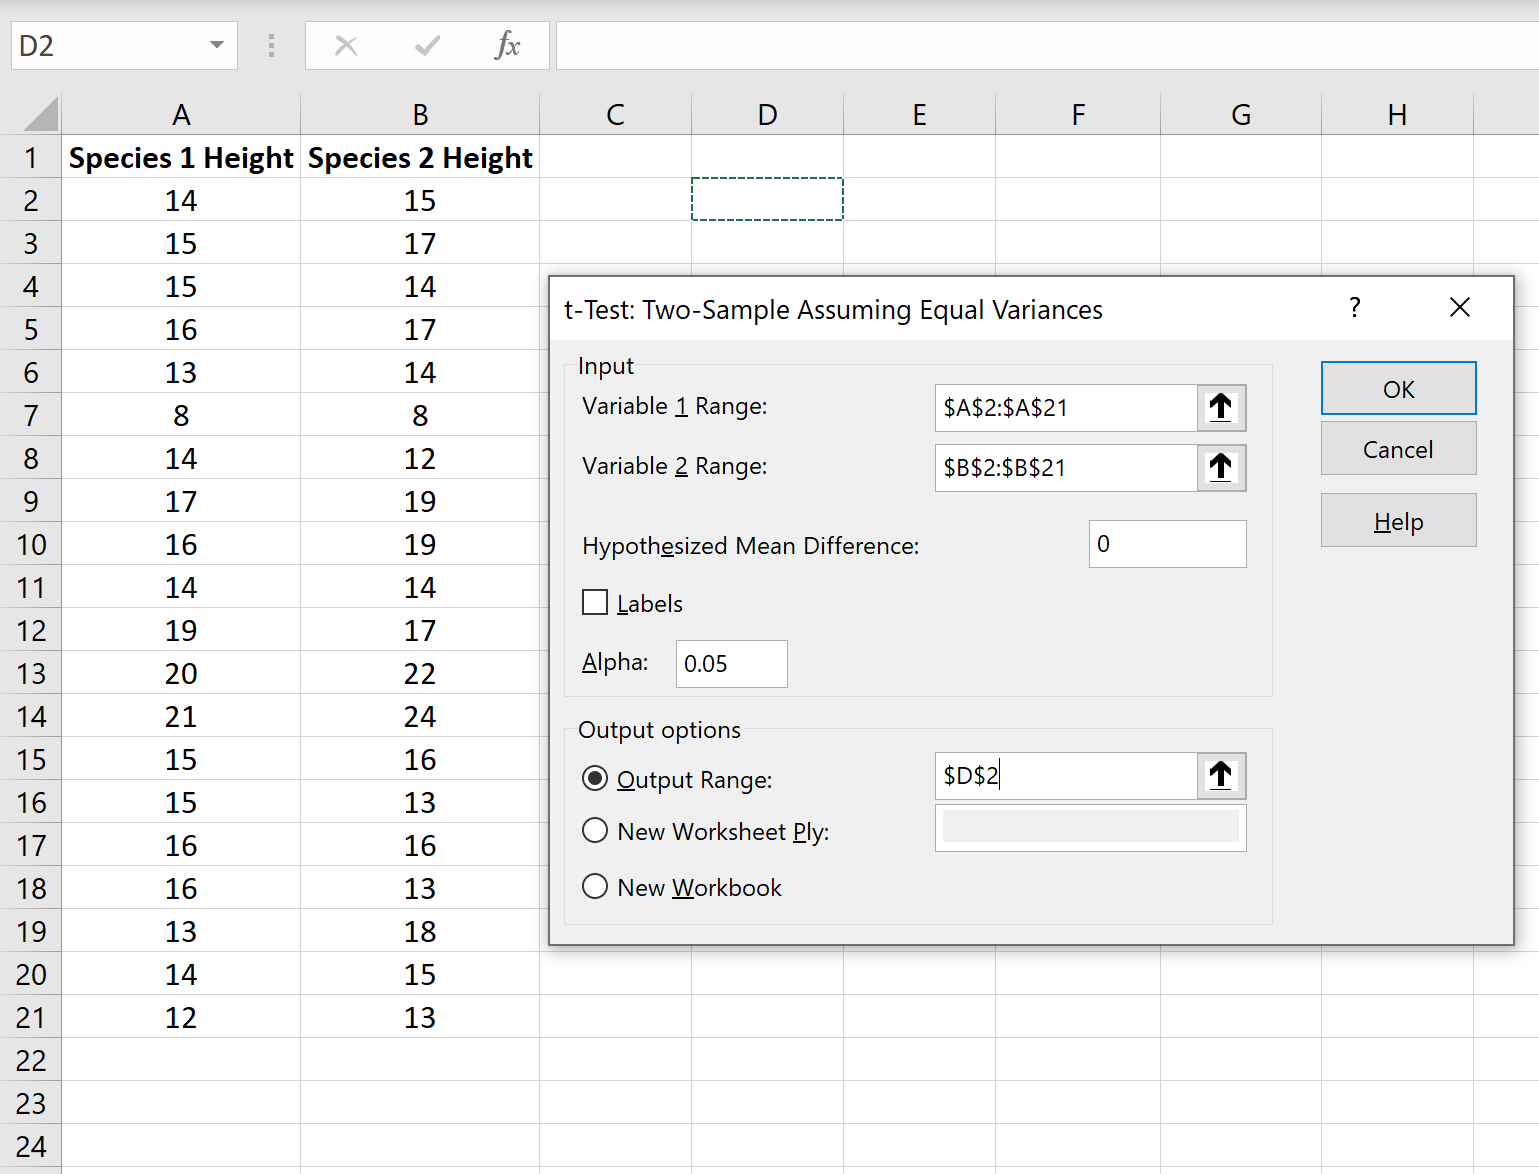
In the window that appears, click the option titled t-Test: Two-Sample Assuming Equal Variances and then click OK. Then enter the following information:
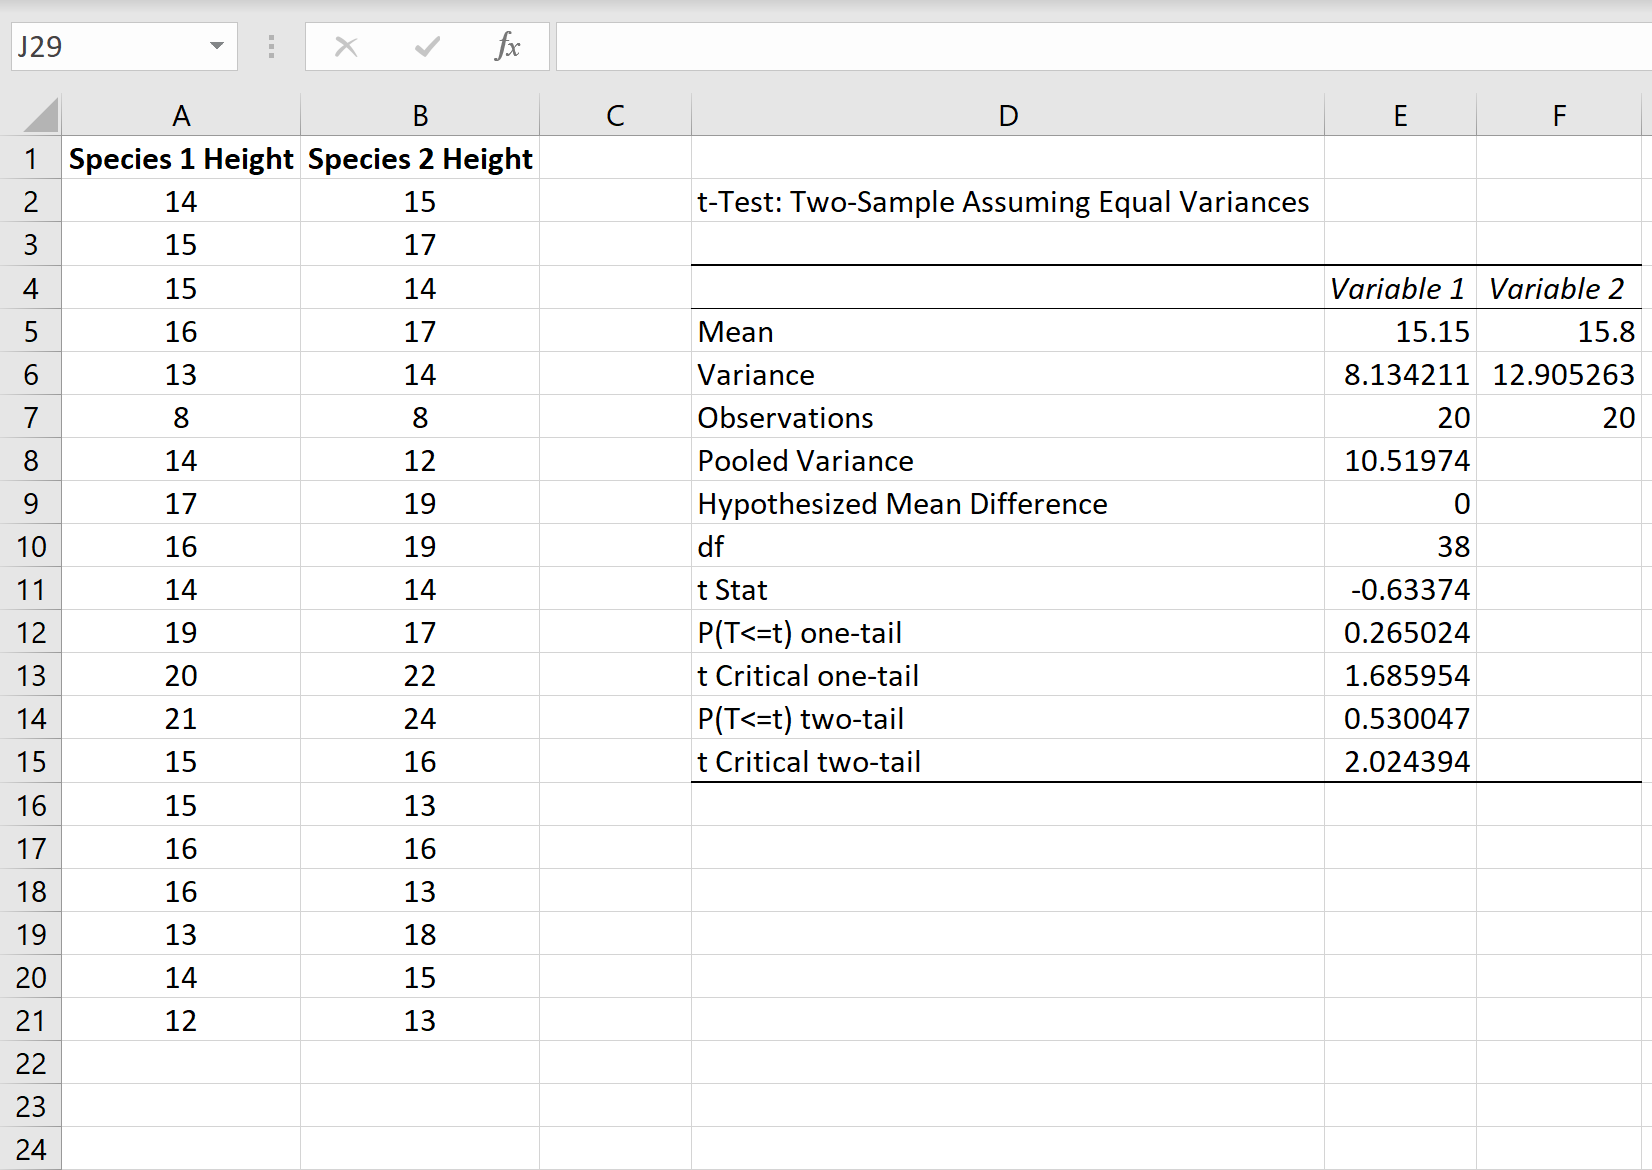
Once you click OK, the results of the t-test will be displayed:
Step 3: Interpret the Results
Here is how to interpret each line in the results:
Mean: The mean of each sample.
- Sample 1 Mean: 15.15
- Sample 2 Mean: 15.8
Variance: The variance of each sample.
- Sample 1 Variance: 8.13
- Sample 2 Variance: 12.9
Observations: The number of observations in each sample.
- Sample 1 Observations: 20
- Sample 2 Observations: 20
Pooled Variance: The average variance of the samples, calculated by “pooling” the variances of each sample together using the following formula:
- s2p = ((n1-1)s21 + (n2-1)s22) / (n1+n2-2)
- s2p = ((20-1)8.13 + (20-1)12.9) / (20+20-2)
- s2p = 10.51974
Hypothesized mean difference: The number that we “hypothesize” is the difference between the two population means. In this case, we chose 0 because we want to test whether or not the difference between the two populations means is 0.
df: The degrees of freedom for the t-test, calculated as:
- df = n1 + n2 – 2
- df = 20 + 20 – 2
- df = 38
t Stat: The test statistic t, calculated as:
- t = (x1 – x2) / √s2p(1/n1 + 1/n2)
- t = (15.15-15.8) / √10.51974(1/20+1/20)
- t = -0.63374
P(TThe p-value for a two-tailed t-test. This value can be found by using any T Score to P Value Calculator using t = -0.63374 with 38 degrees of freedom.
In this case, p = 0.530047. This is larger than 0.05, so we fail to reject the null hypothesis. This means we do not have sufficient evidence to say that the two population means are different.
t Critical two-tail: This is the critical value of the test. This value can be found by using a t Critical value Calculator with 38 degrees of freedom and a 95% confidence level.
In this case, the critical value turns out to be 2.024394. Since our test statistic t is less than this value, we fail to reject the null hypothesis. Once again, this means we do not have sufficient evidence to say that the two population means are different.
Note #1: You will arrive at the same conclusion whether you use the p-value method or the critical value method.
Note #2: If you are performing a one-tailed hypothesis test, you will instead use the values for P(T
Additional Resources
The following tutorials provide step-by-step examples of how to perform various t-tests in Excel:
How to Conduct a One Sample t-Test in Excel
How to Conduct a Two Sample t-Test in Excel
How to Conduct a Paired Samples t-Test in Excel
How to Perform Welch’s t-test in Excel