You can easily add a plot to a Matplotlib plot by using the following code:
import matplotlib.pyplot as plt

#add legend to plot
plt.legend()
And you can easily change the font size of the text in the legend by using one of the following methods:
Method 1: Specify a Size in Numbers
You can specify font size by using a number:
plt.legend(fontsize=18)
Method 2: Specify a Size in Strings
You can also specify font size by using strings:
plt.legend(fontsize="small")
Options include:
- xx-small
- x-small
- small
- medium
- large
- x-large
- xx-large
The following examples show how to use each of these methods in practice:
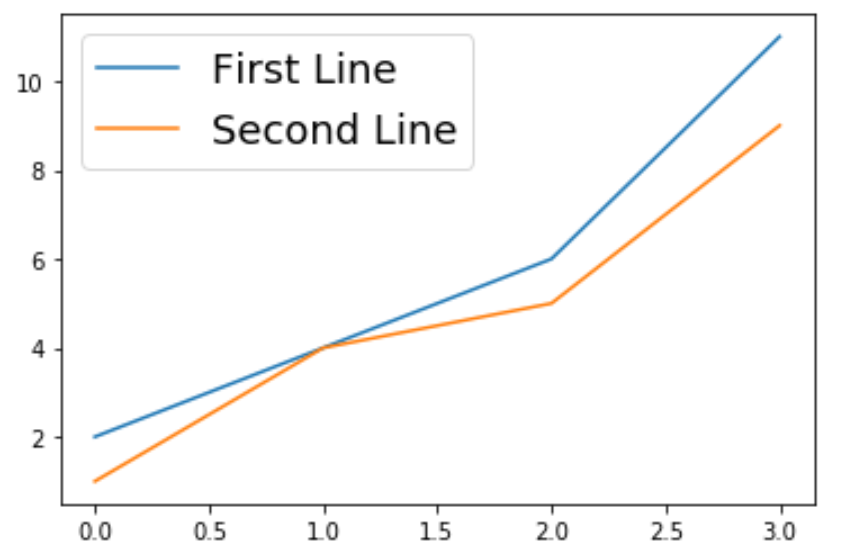
Example 1: Specify Font Size Using a Number
The following example shows how to specify a legend font size using a number:
import matplotlib.pyplot as plt

#create data
plt.plot([2, 4, 6, 11], label="First Line")
plt.plot([1, 4, 5, 9], label="Second Line")

#add legend
plt.legend(fontsize=18)

#show plot
plt.show()
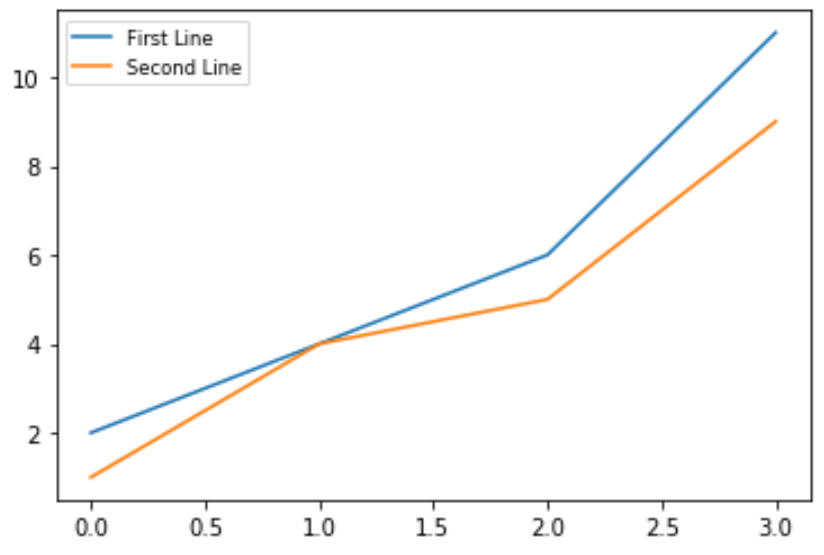
Example 2: Specify Font Size Using a String
The following example shows how to specify a legend font size using a string:
import matplotlib.pyplot as plt

#create data
plt.plot([2, 4, 6, 11], label="First Line")
plt.plot([1, 4, 5, 9], label="Second Line")

#add legend
plt.legend(fontsize="small")

#show plot
plt.show()
Additional Resources
How to Change Font Sizes on a Matplotlib Plot
How to Add Text to Matplotlib Plots