To normalize the values in a dataset to be between 0 and 100, you can use the following formula:
zi = (xi – min(x)) / (max(x) – min(x)) * 100
where:
- zi: The ith normalized value in the dataset
- xi: The ith value in the dataset
- min(x): The minimum value in the dataset
- max(x): The maximum value in the dataset
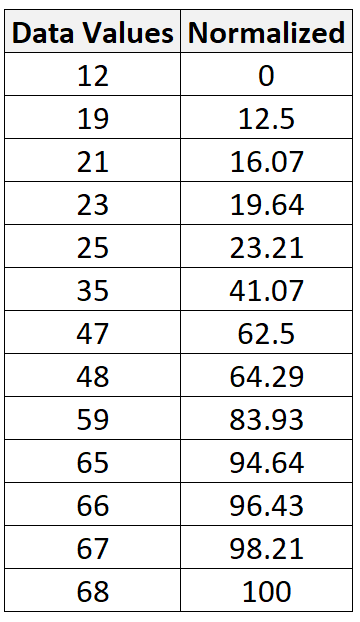
For example, suppose we have the following dataset:

The minimum value in the dataset is 12 and the maximum value is 68.
To normalize the first value of 12, we would apply the formula shared earlier:
- zi = (xi – min(x)) / (max(x) – min(x)) * 100 = (12 – 12) / (68 – 12) * 100 = 0
To normalize the second value of 19, we would use the same formula:
- zi = (xi – min(x)) / (max(x) – min(x)) * 100 = (19 – 12) / (68 – 12) * 100 = 12.5
To normalize the third value of 21, we would use the same formula:
- zi = (xi – min(x)) / (max(x) – min(x)) * 100 = (21 – 12) / (68 – 12) * 100 = 16.07
We can use this exact same formula to normalize each value in the original dataset to be between 0 and 100:
How to Normalize Data Between Any Range
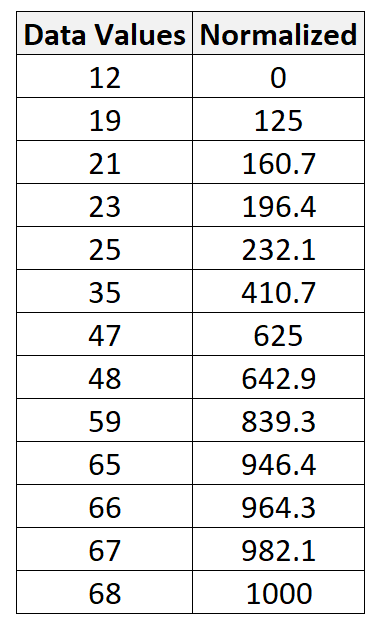
We can actually use this formula to normalize a dataset between 0 and any number:
zi = (xi – min(x)) / (max(x) – min(x)) * Q
where Q is the maximum number you want for your normalized data values.
In the previous example we chose Q to be equal to 100, but we could easily normalize a range of data values between 0 and 1,000 by choosing Q to be 1,000:
To normalize the first value of 12, we would apply the formula:
- zi = (xi – min(x)) / (max(x) – min(x)) * 1,000 = (12 – 12) / (68 – 12) * 100 = 0
To normalize the second value of 19, we would use the same formula:
- zi = (xi – min(x)) / (max(x) – min(x)) * 1,000 = (19 – 12) / (68 – 12) * 100 = 125
To normalize the third value of 21, we would use the same formula:
- zi = (xi – min(x)) / (max(x) – min(x)) * 1,000 = (21 – 12) / (68 – 12) * 100 = 160.7
We can use this exact same formula to normalize each value in the original dataset to be between 0 and 1,000:
When to Normalize Data
Occasionally we normalize variables when performing some type of analysis in which we have multiple variables that are measured on different scales and we want each of the variables to have the same range.
This prevents one variable from being overly influential, especially if it’s measured in different units (i.e. if one variable is measured in inches and another is measured in yards).
It’s also worth noting that we used a method known as min-max normalization in this tutorial to normalize the data values.
The two most common normalization methods are as follows:
1. Min-Max Normalization
- Objective: Converts each data value to a value between 0 and 100.
- Formula: New value = (value – min) / (max – min) * 100
2. Mean Normalization
- Objective: Scales values such that the mean of all values is 0 and std. dev. is 1.
- Formula: New value = (value – mean) / (standard deviation)
Additional Resources
How to Normalize Data Between 0 and 1
How to Normalize Data in Excel
How to Normalize Data in R
How to Normalize Columns in Python