A histogram is a type of chart that allows us to visualize the distribution of values in a dataset.
The x-axis displays the values in the dataset and the y-axis shows the frequency of each value.
Depending on the values in the dataset, a histogram can take on many different shapes.
The following examples show how to describe a variety of different histograms.
1. Bell-Shaped
A histogram is bell-shaped if it resembles a “bell” curve and has one single peak in the middle of the distribution. The most common real-life example of this type of distribution is the normal distribution.

2. Uniform
A histogram is described as “uniform” if every value in a dataset occurs roughly the same number of times. This type of histogram often looks like a rectangle with no clear peaks.

3. Bimodal
A histogram is described as “bimodal” if it has two distinct peaks. We often say that this type of distribution has multiple modes – that is, multiple values occur most frequently in the dataset.
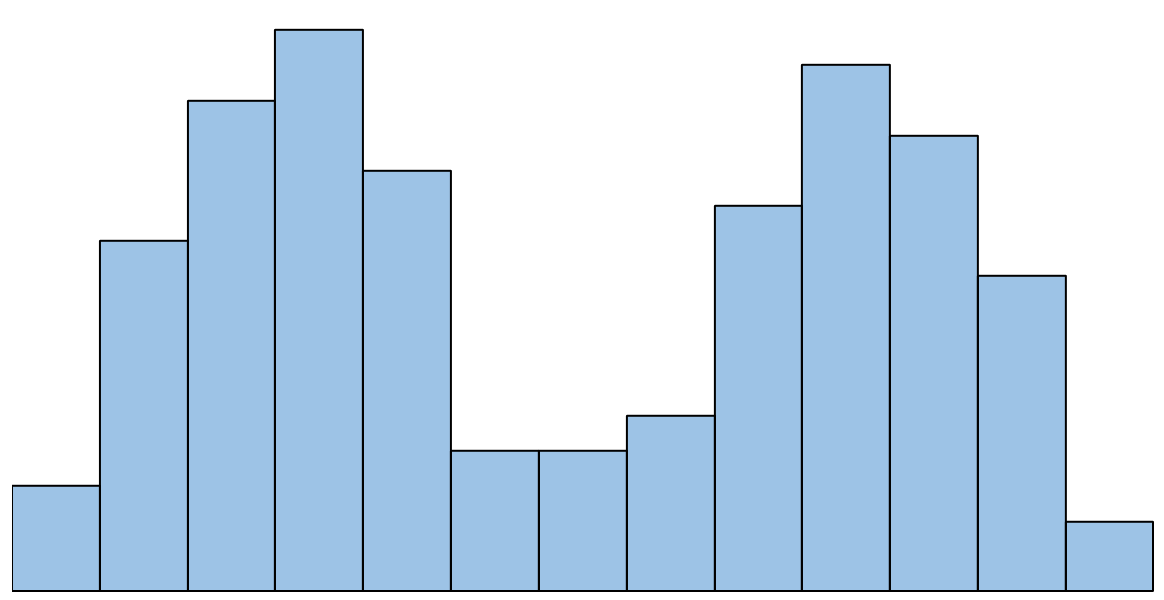
Related: What is a Bimodal Distribution?
4. Multimodal
A histogram is described as “multimodal” if it has more than two distinct peaks.

Related: What is a Multimodal Distribution?
5. Left Skewed
A histogram is left skewed if it has a “tail” on the left side of the distribution. Sometimes this type of distribution is also called “negatively” skewed.
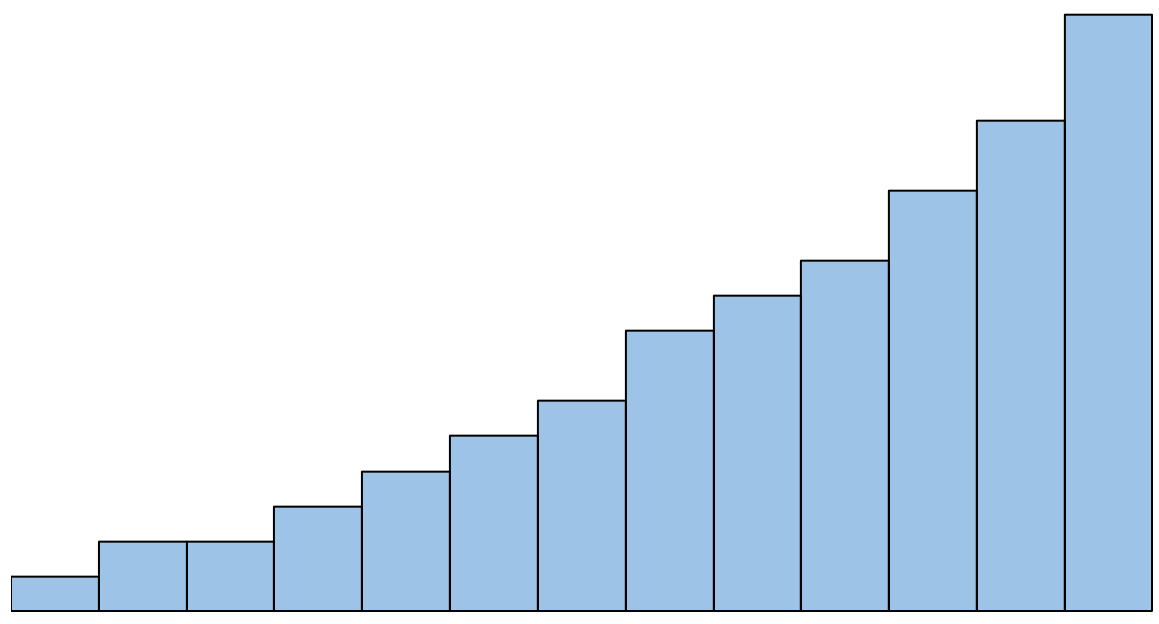
Related: 5 Examples of Negatively Skewed Distributions
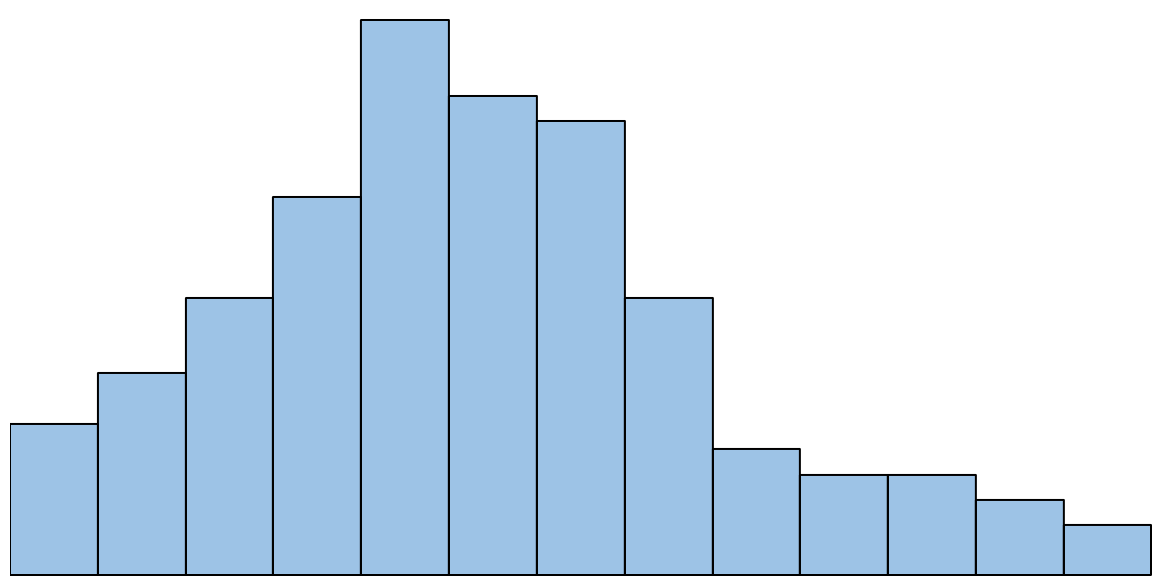
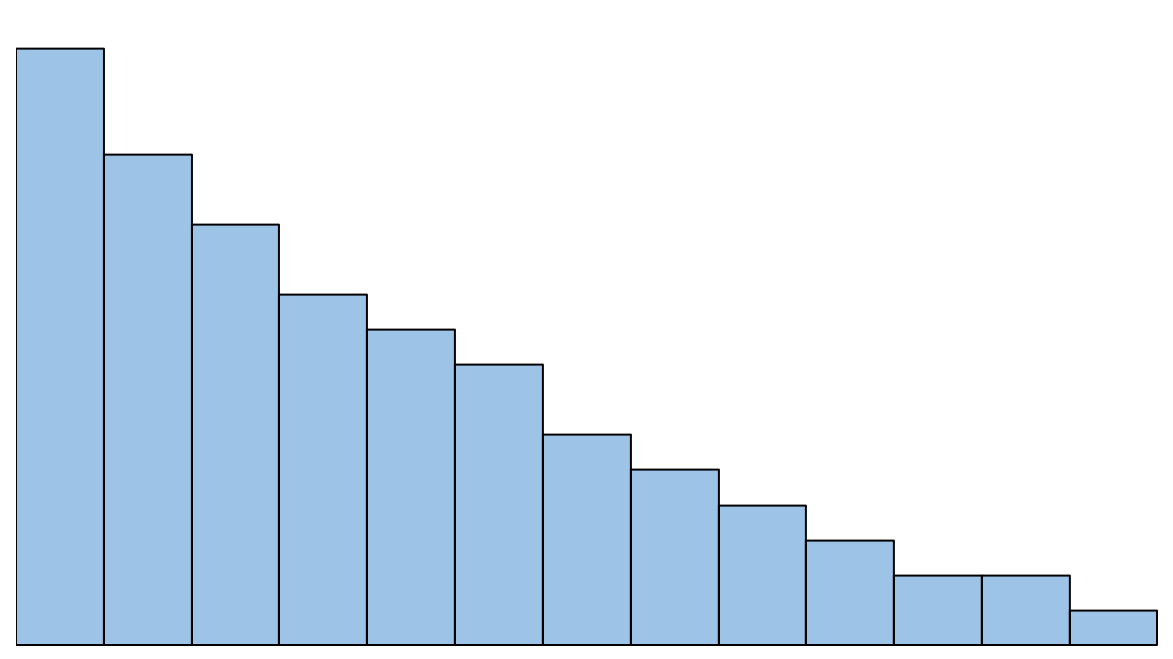
6. Right Skewed
A histogram is right skewed if it has a “tail” on the right side of the distribution. Sometimes this type of distribution is also called “positively” skewed.
Related: 5 Examples of Positively Skewed Distributions
7. Random
The shape of a distribution can be described as “random” if there is no clear pattern in the data at all.

Additional Resources
The following tutorials provide more information on how to describe distributions.
Left Skewed vs. Right Skewed Distributions
What is a Symmetric Distribution?
What is a Relative Frequency Histogram?
How to Estimate the Mean and Median of Any Histogram