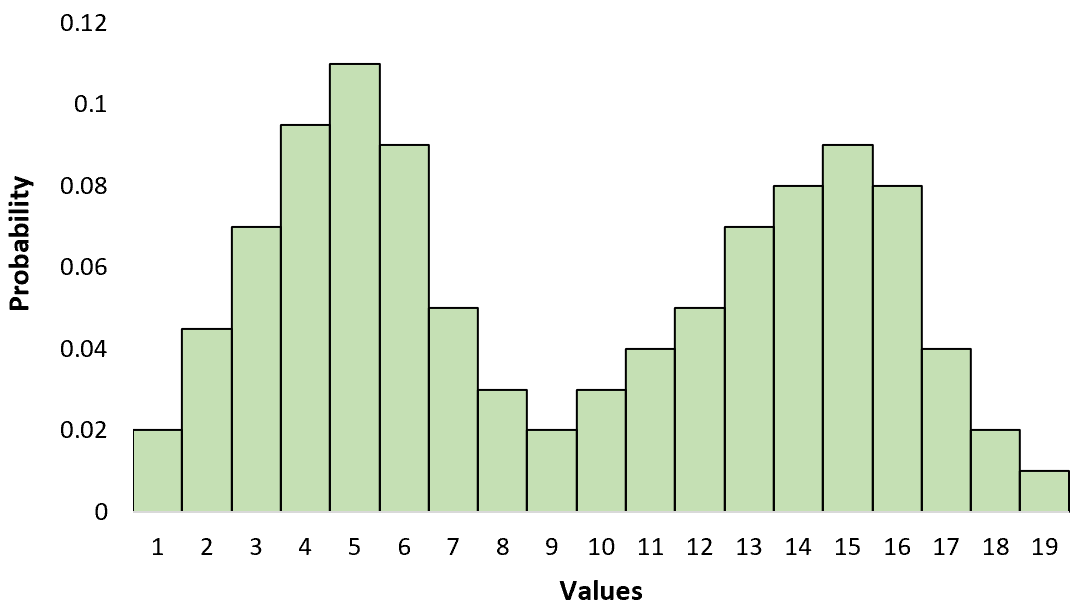
A bimodal distribution is a probability distribution with two modes.
We often use the term “mode” in descriptive statistics to refer to the most commonly occurring value in a dataset, but in this case the term “mode” refers to a local maximum in a chart.
When you visualize a bimodal distribution, you will notice two distinct “peaks” that represent these two modes.
This is different than a unimodal distribution that only has one peak:
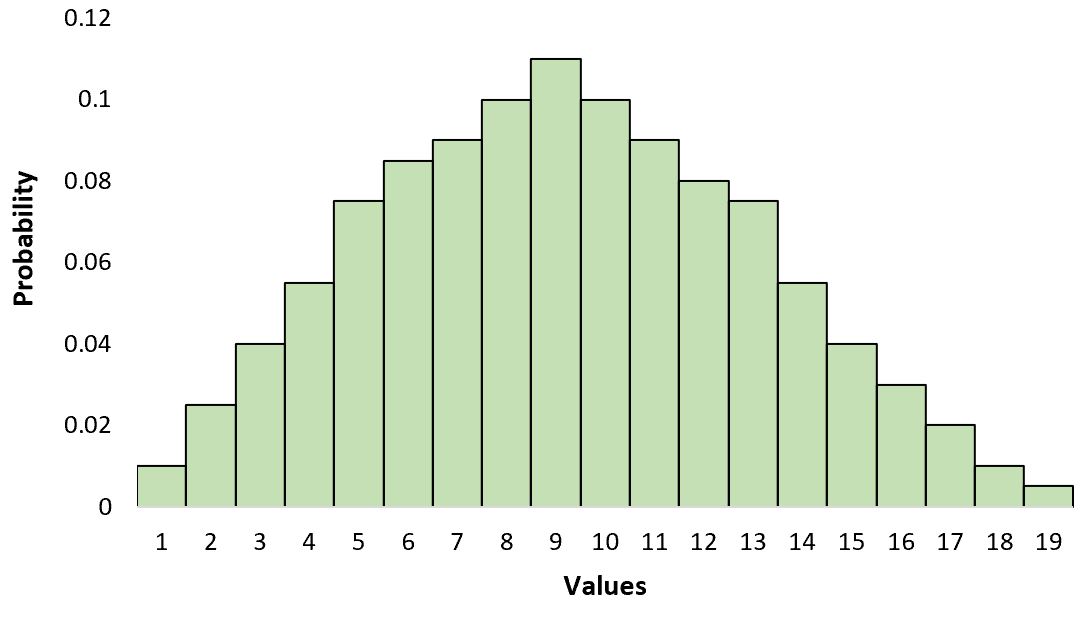
You can remember the difference between the two by remembering:
- “bi” = two
- “uni” = one
Although most statistics courses use unimodal distributions like the normal distribution to explain different topics, bimodal distributions actually show up fairly often in practice so it’s useful to know how to recognize and interpret them.
Note: A bimodal distribution is a specific type of multimodal distribution.
Examples of Bimodal Distributions
Here are some examples of bimodal distributions:
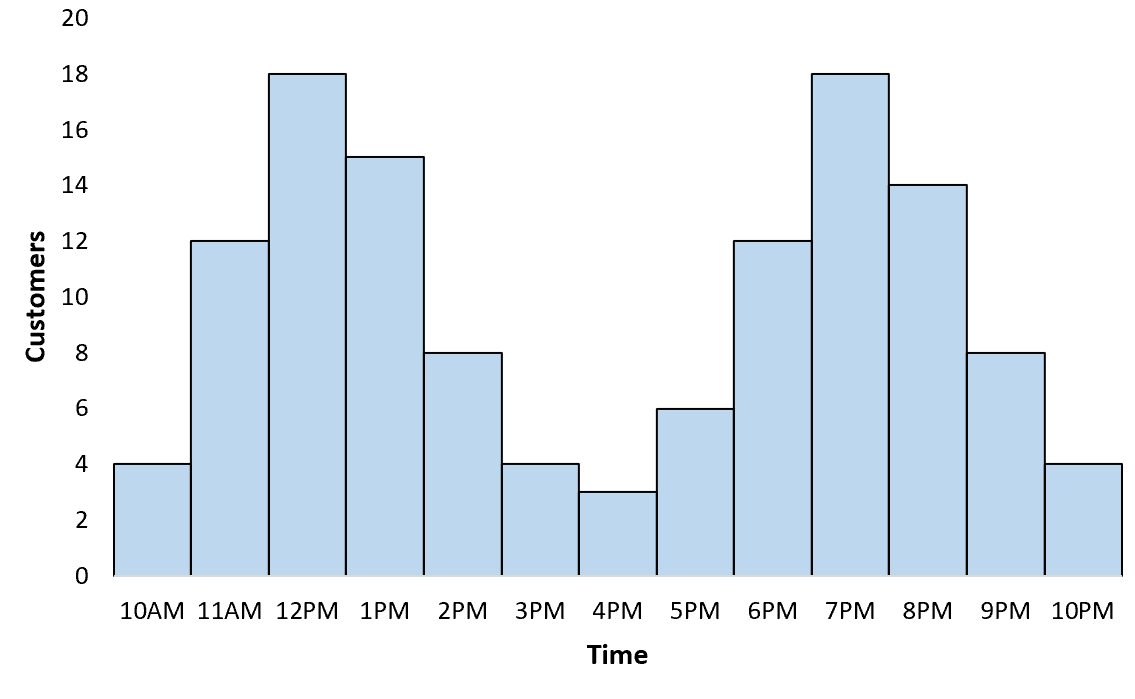
Example #1: Peak restaurant hours
If you created a graph to visualize the distribution of customers at a certain restaurant by hour, you’d likely find that it follows a bimodal distribution with a peak during lunch hours and another peak during dinner hours:
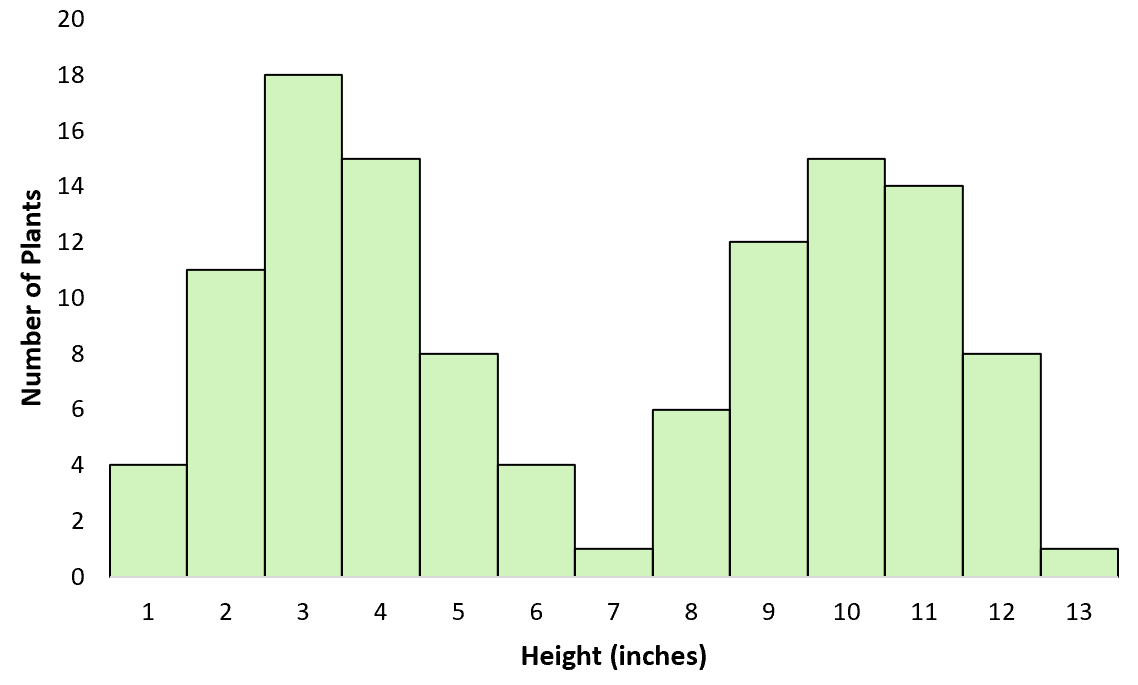
Example #2: Average height of two plant species
Suppose you went around a field and measured the height of different plants. Without realizing it, you measure the height of two different species – one that is quite tall and another that is quite short. If you created a graph to visualize the distribution of heights, it would follow a bimodal distribution:
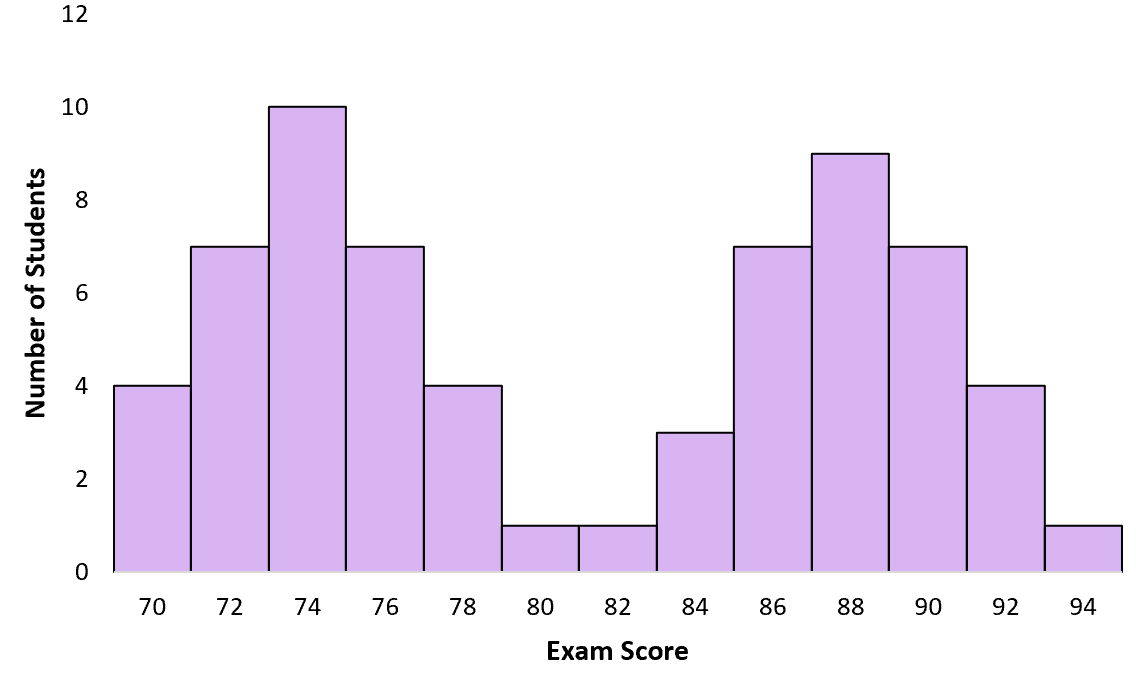
Example #3: Exam scores
Suppose a teacher gives an exam to his class of students. Some of the students studied for the exam, while others did not. When the teacher creates a graph of the exam scores, it follows a bimodal distribution with one peak around low scores for students who didn’t study and another peak around high scores for students who did study:
What Causes Bimodal Distributions?
There are typically two things that cause bimodal distributions:
1. Some underlying phenomena.
Often bimodal distributions occur because of some underlying phenomena.
For example, the number of customers who visit a restaurant each hour follows a bimodal distribution since people tend to eat out during two distinct times: lunch and dinner. This underlying human behavior is what causes the bimodal distribution.
2. Two different groups being lumped together.
Bimodal distributions can also occur when you’re simply analyzing two different groups of things without realizing it.
For example, if you measure the height of plants in a certain field without realizing that two different species are growing in the same field, you’ll see a bimodal distribution when you create a chart.
How to Analyze Bimodal Distributions
We often describe distributions using the mean or median since this gives us an idea of where the “center” of the distribution is located.
Unfortunately, the mean and median aren’t useful to know for a bimodal distribution. For example, the mean exam score for students in the example above is 81:
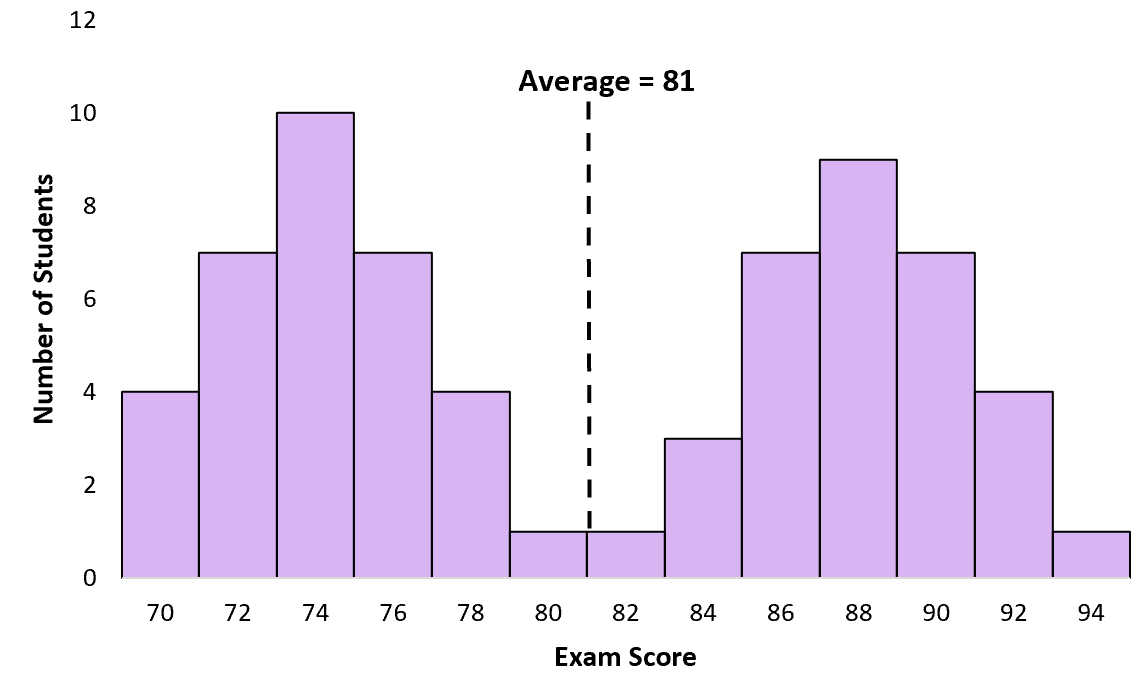
However, very few students actually scored close to 81. In this case, the mean is misleading. Most students actually scored around 74 or around 88.
A better way to analyze and interpret bimodal distributions is to simply break the data into two separate groups, then analyze the center and the spread for each group.
For example, we may break up the exam scores into “low scores” and “high scores” and then find the mean and standard deviation for each group.
If you’re sharing the results of some analysis and your data does follow a bimodal distribution, it’s helpful to create a histogram like the ones shown above so that your audience can clearly see that the distribution has two distinct “peaks” and that it only makes sense to analyze each peak separately rather than as one large dataset.