You can use the following methods to add a vertical line to a histogram in R:
Method 1: Add Solid Vertical Line at Specific Location
abline(v=2)
This syntax adds one vertical line to the histogram at x=2.
Method 2: Add Customized Vertical Line at Specific Location
abline(v=mean(data), col='red', lwd=3, lty='dashed')
This syntax adds one vertical red dashed line with a width of 3 at the mean value of the histogram.
Method 3: Add Multiple Customized Vertical Lines
abline(v=quantile(data, .25), col='red', lwd=3)
abline(v=quantile(data, .75), col='blue', lwd=3)
This syntax adds a red vertical line at the first quartile and a blue vertical line at the third quartile of the histogram.
The following examples show how to use each method in practice.
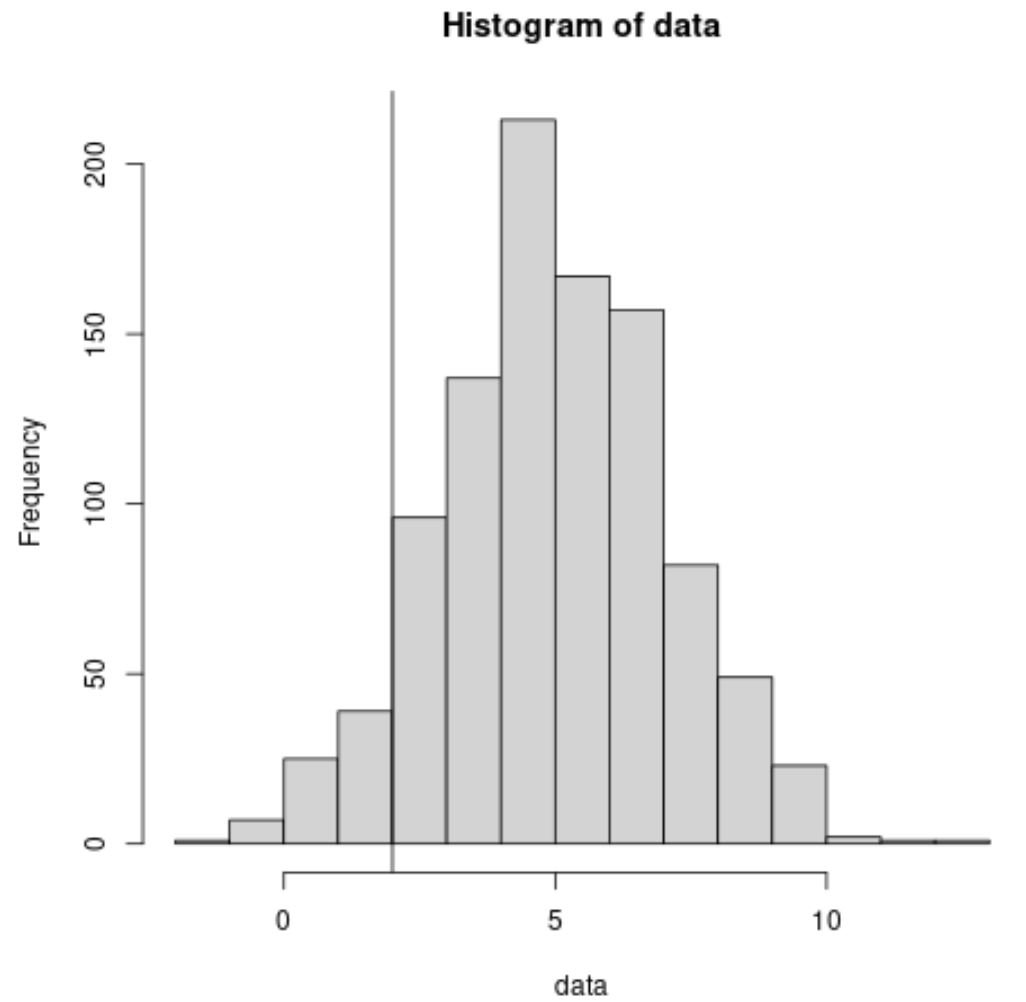
Example 1: Add Solid Vertical Line at Specific Location
The following code shows how to create a histogram and add a vertical line at x=2:
#make this example reproducible
set.seed(1)

#create data
data 1000, mean=5, sd=2)

#create histogram to visualize distribution of data
hist(data)

#add vertical line at x=2
abline(v=2)
Example 2: Add Customized Vertical Line at Specific Location
The following code shows how to create a histogram and add one vertical red dashed line with a width of 3 at the mean value of the histogram:
#make this example reproducible
set.seed(1)

#create data
data 1000, mean=5, sd=2)

#create histogram to visualize distribution of data
hist(data)

#add vertical line at mean value
abline(v=mean(data), col='red', lwd=3, lty='dashed')
Example 3: Add Multiple Customized Vertical Lines
The following code shows how to create a histogram and add a red vertical line at the first quartile and a blue vertical line at the third quartile of the histogram.
#make this example reproducible
set.seed(1)

#create data
data 1000, mean=5, sd=2)

#create histogram to visualize distribution of data
hist(data)

#add vertical lines at 1st and third quartiles
abline(v=quantile(data, .25), col='red', lwd=3)
abline(v=quantile(data, .75), col='blue', lwd=3)
Additional Resources
The following tutorials explain how to perform other common tasks in R:
How to Create a Relative Frequency Histogram in R
How to Overlay Normal Curve on Histogram in R
How to Use abline() Function in R