A relative frequency histogram is a graph that displays the relative frequencies of values in a dataset.
This tutorial explains how to create a relative frequency histogram in R by using the histogram() function from the lattice, which uses the following syntax:
histogram(x, type)
where:
- x: data
- type: type of relative frequency histogram you’d like to create; options include percent, count, and density.
Default Histogram
First, load the lattice package:
library(lattice)
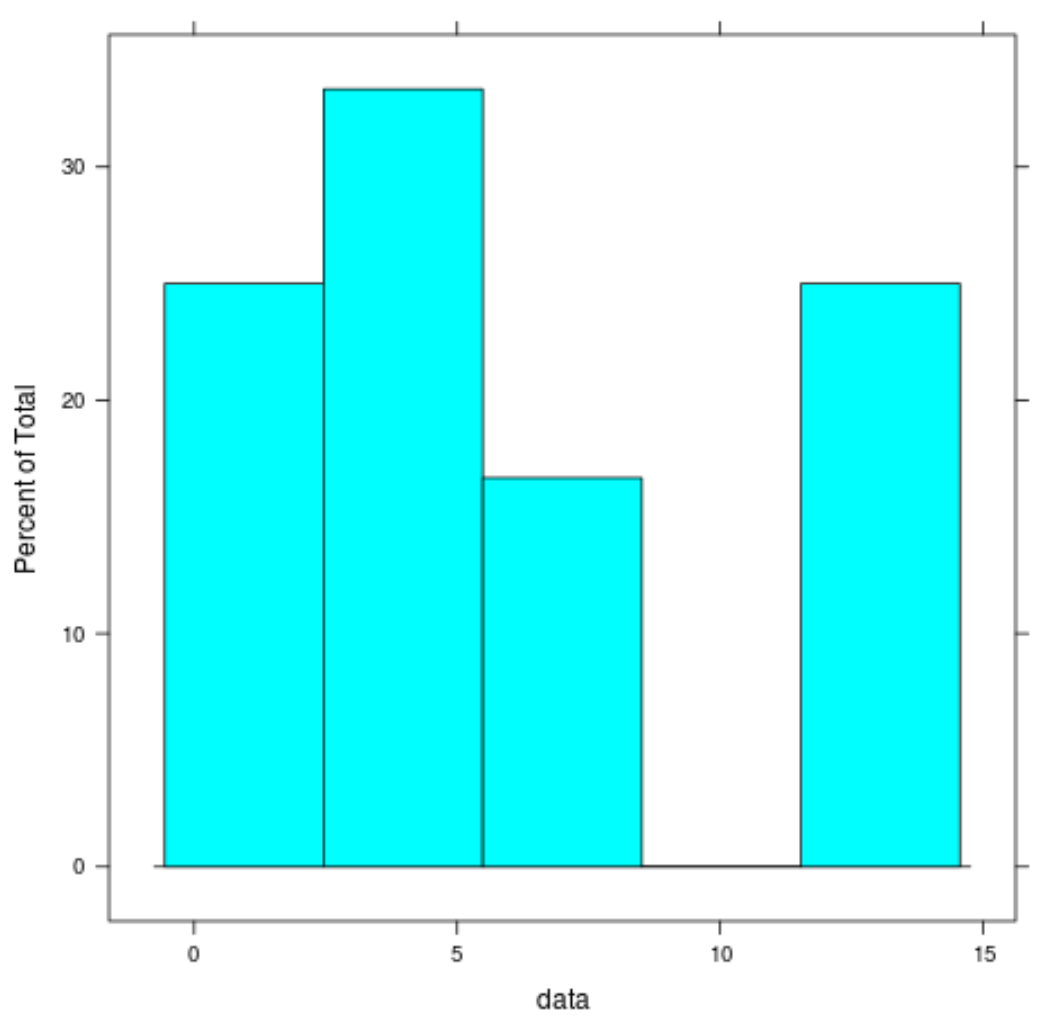
By default, this package creates a relative frequency histogram with percent along the y-axis:
#create data
data #create relative frequency histogram
histogram(data)
Modifying the Histogram
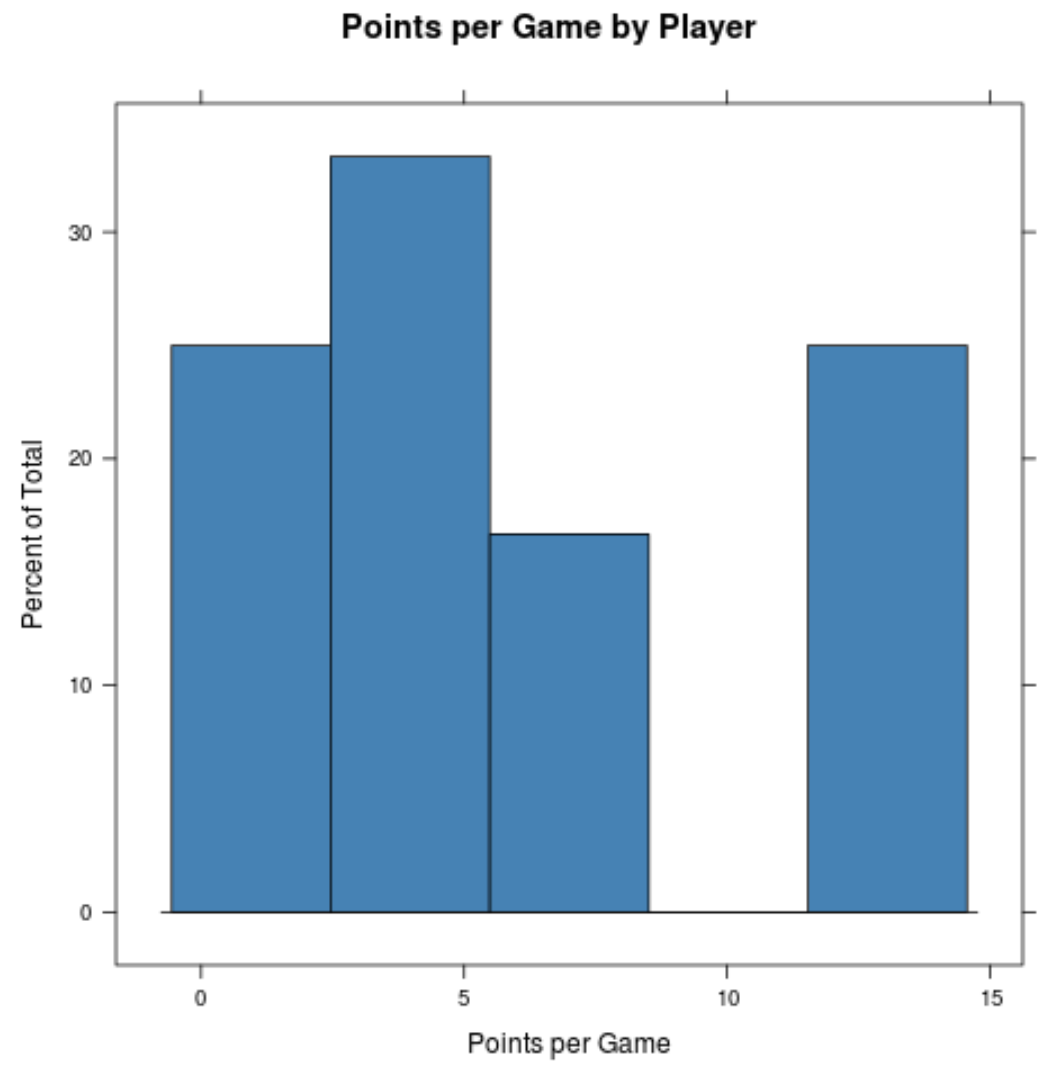
We can modify the histogram to include a title, different axes labels, and a different color using the following arguments:
- main: the title
- xlab: the x-axis label
- ylab: the y-axis label
- col: the fill color to use in the histogram
For example:
#modify the histogram
histogram(data,
          main='Points per Game by Player',
          xlab='Points per Game',
          col='steelblue')
Modifying the Numbers of Bins
We can specify the number of bins to use in the histogram using the breaks argument:
#modify the number of bins
histogram(data,
          main='Points per Game by Player',
          xlab='Points per Game',
          col='steelblue',
          breaks=15)
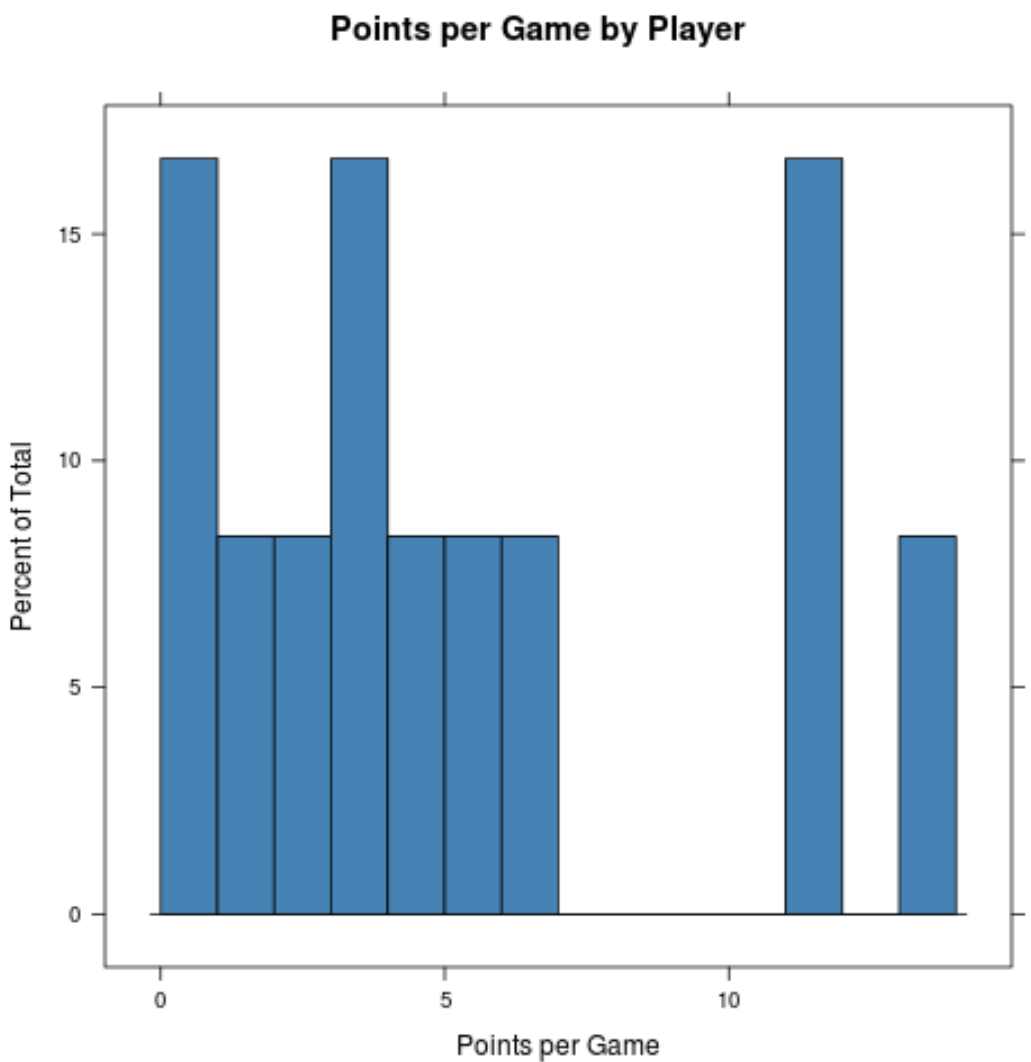
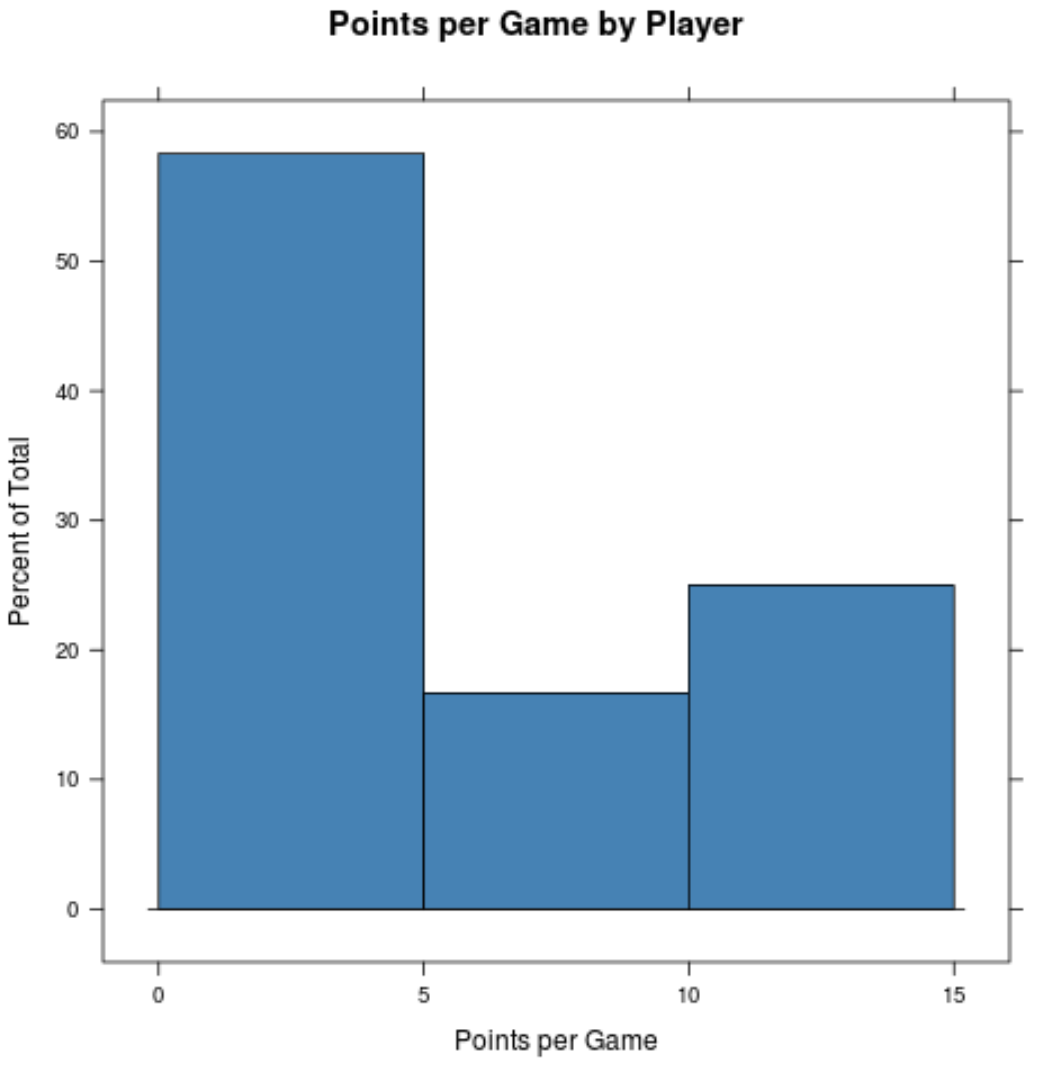
The more bins you specify, the more you will be able to get a granular look at your data. Conversely, the fewer number of bins you specify, the more aggregated the data will become:
#modify the number of bins
histogram(data,
          main='Points per Game by Player',
          xlab='Points per Game',
          col='steelblue',
          breaks=3)
Related: Use Sturges’ Rule to identify the optimal number of bins to use in a histogram.