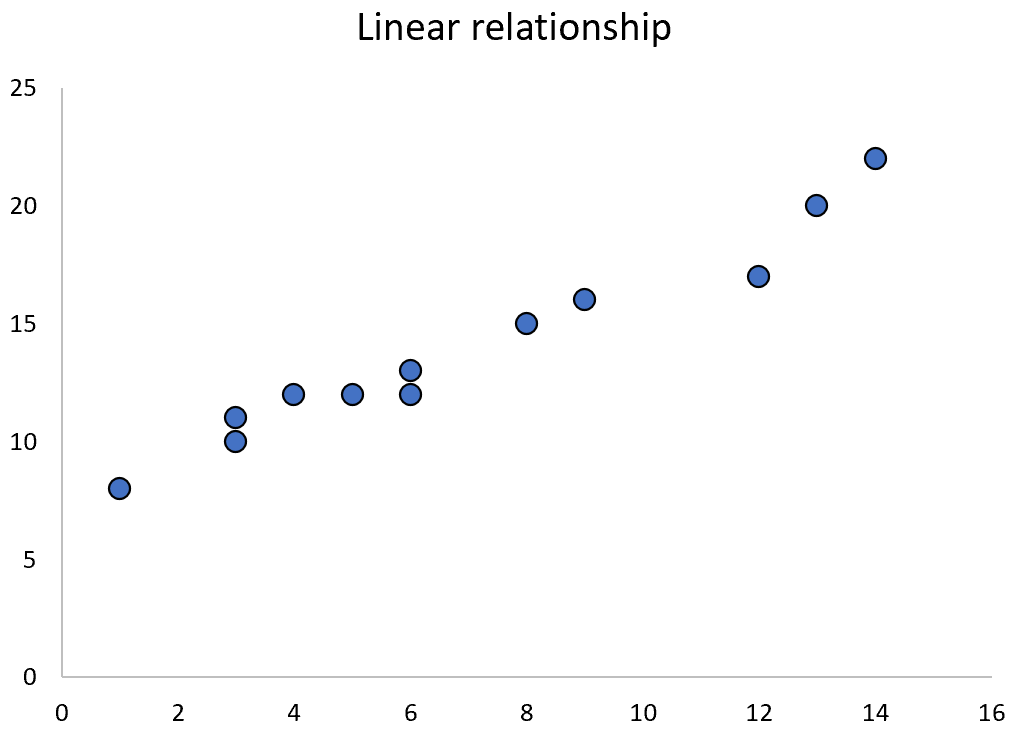
When two variables have a linear relationship, we can often use simple linear regression to quantify their relationship.
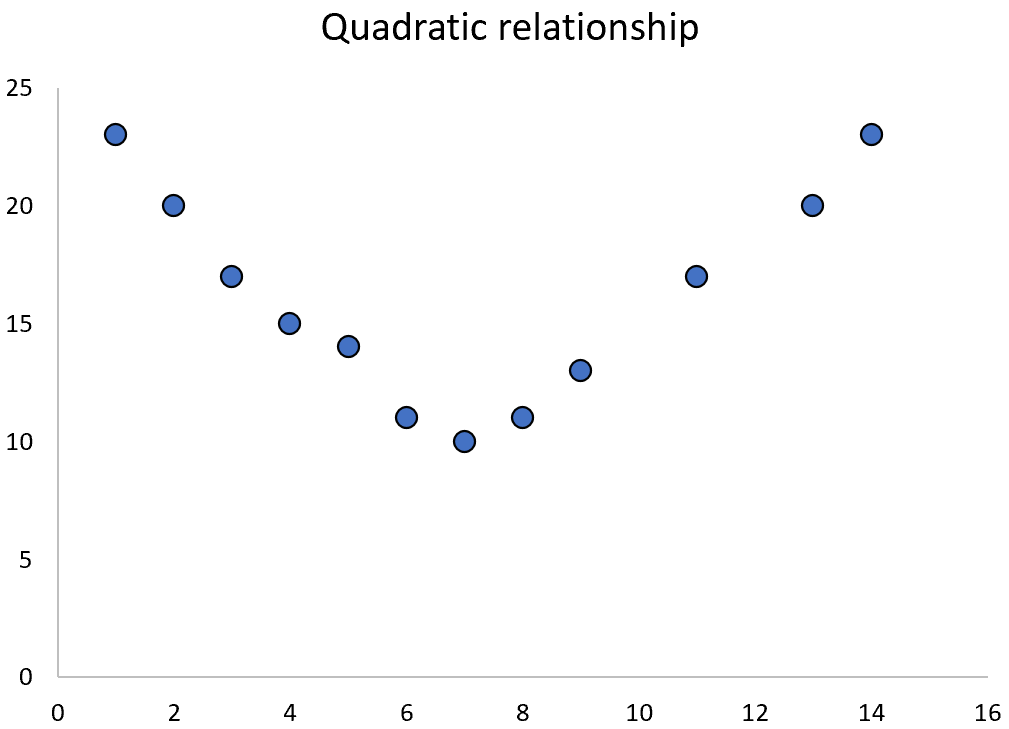
However, when two variables have a quadratic relationship, we can instead use quadratic regression to quantify their relationship.
This tutorial explains how to perform quadratic regression on a TI-84 Calculator.
Example: Quadratic Regression on a TI-84 Calculator
Suppose we are interested in understanding the relationship between number of hours worked and happiness. We have the following data on the number of hours worked per week and the reported happiness level (on a scale of 0-100) for 11 different people:

Use the following steps to perform a quadratic regression on a TI-84 calculator.
Step 1: Visualize the data.
Before we can use quadratic regression, we need to make sure that the relationship between the explanatory variable (hours) and response variable (happiness) is actually quadratic.
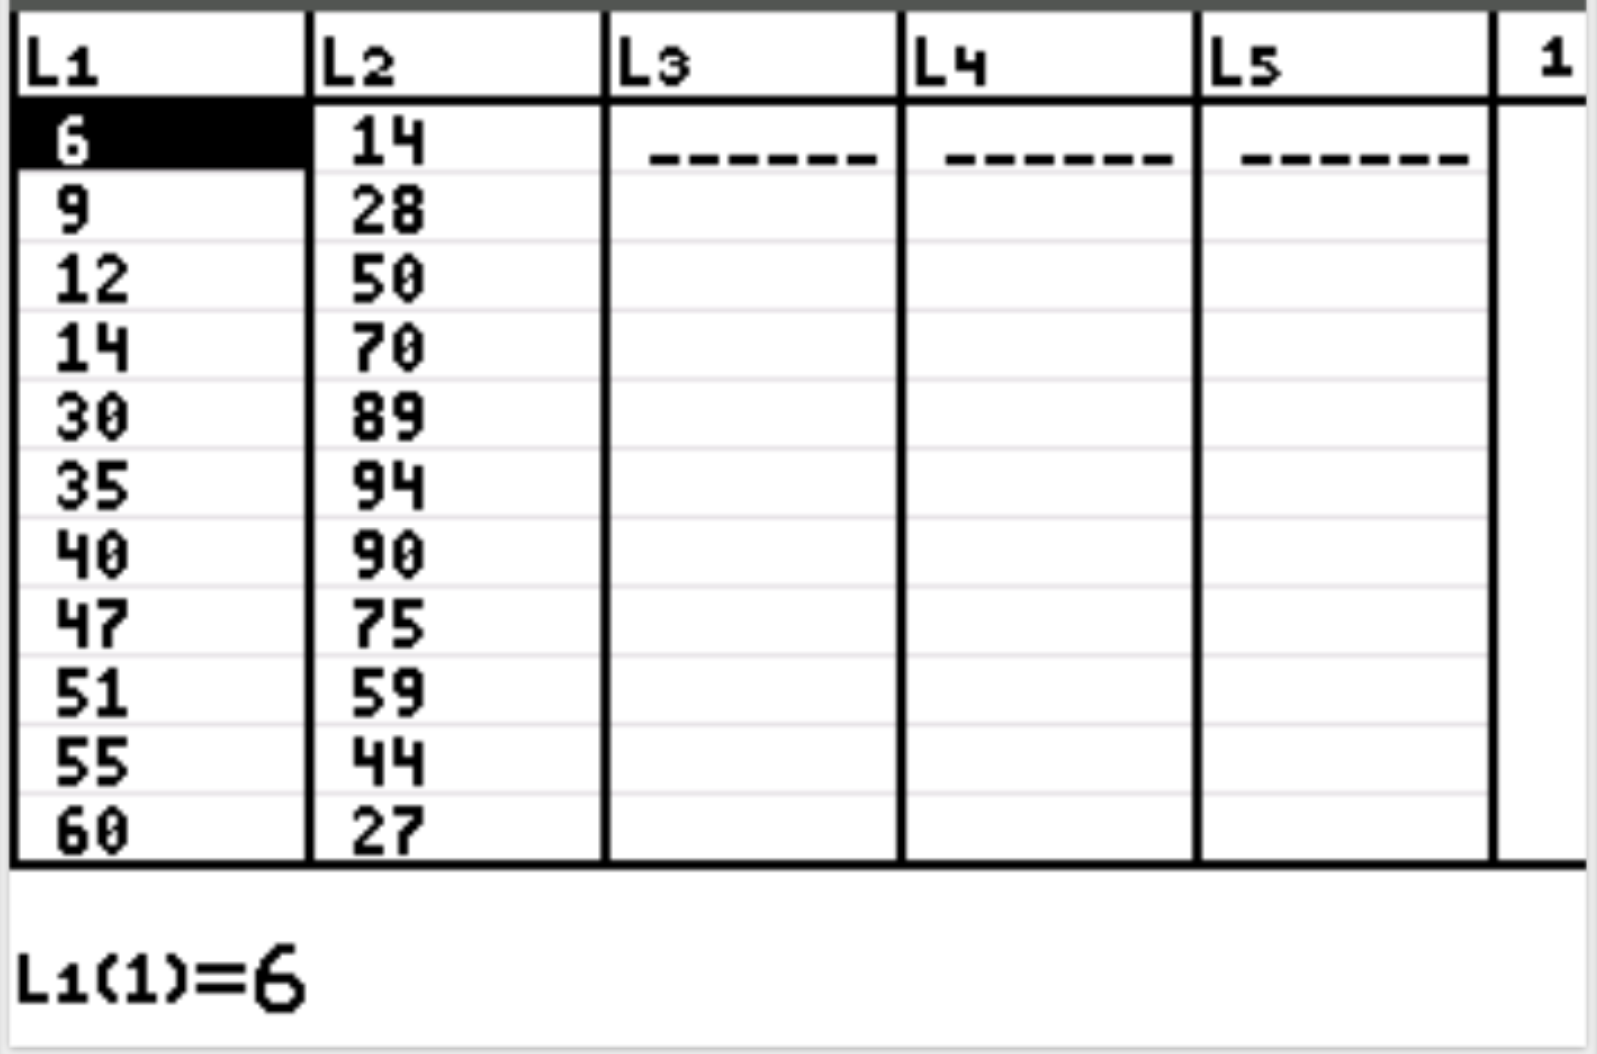
First, we will input the data values for both the explanatory and the response variable. Press Stat and then press EDIT . Enter the following values for the explanatory variable (hours worked) in column L1 and the values for the response variable (happiness) in column L2:
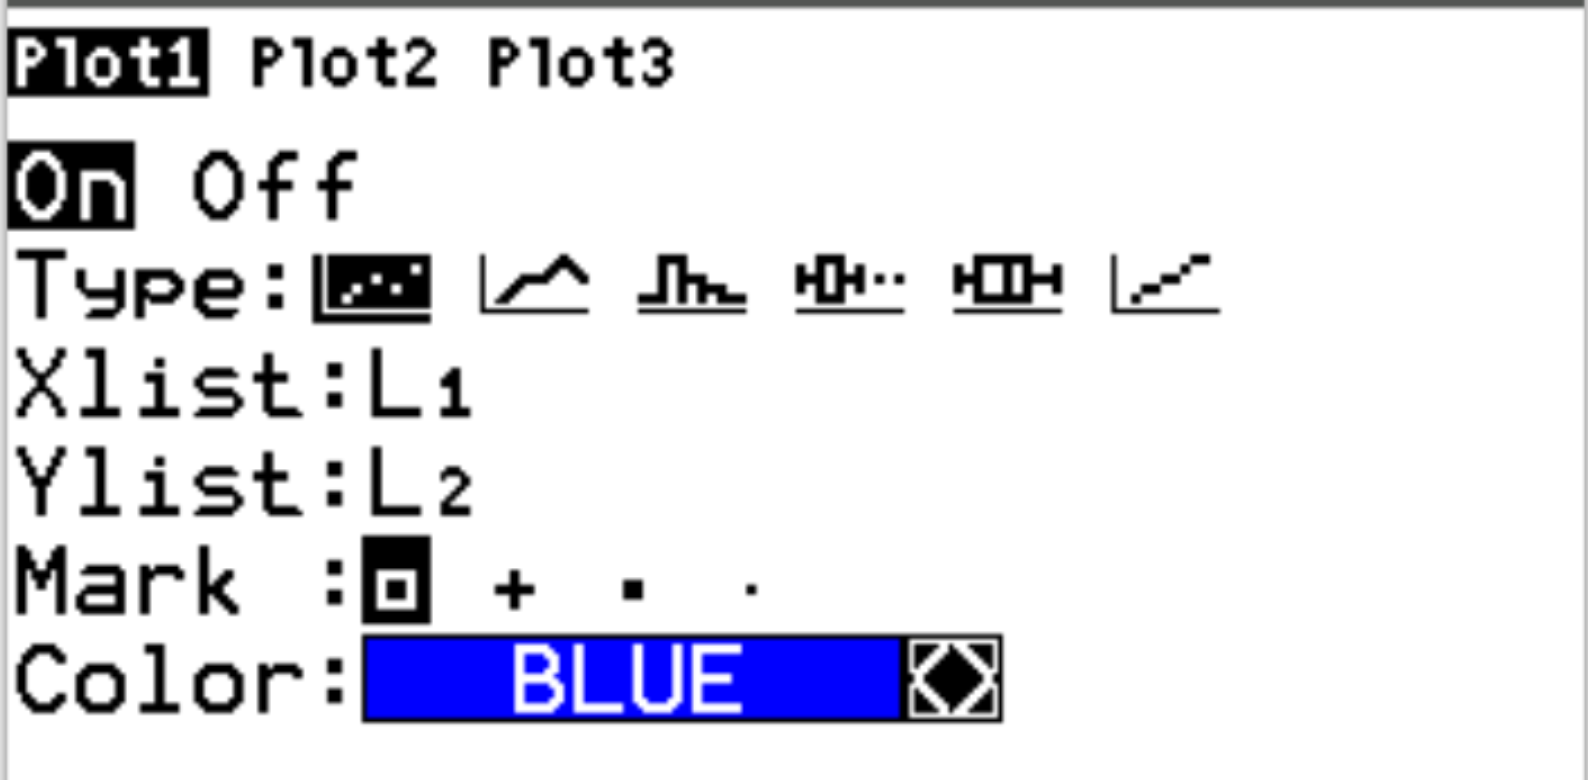
Next, press 2nd and then press y= to access the statplot menu. Highlight Plot1 and press Enter. Make sure the plot is on and that L1 and L2 are selected for Xlist and Ylist, respectively:
Next, press zoom and then press 9:ZoomStat. This will automatically produce the following scatterplot:
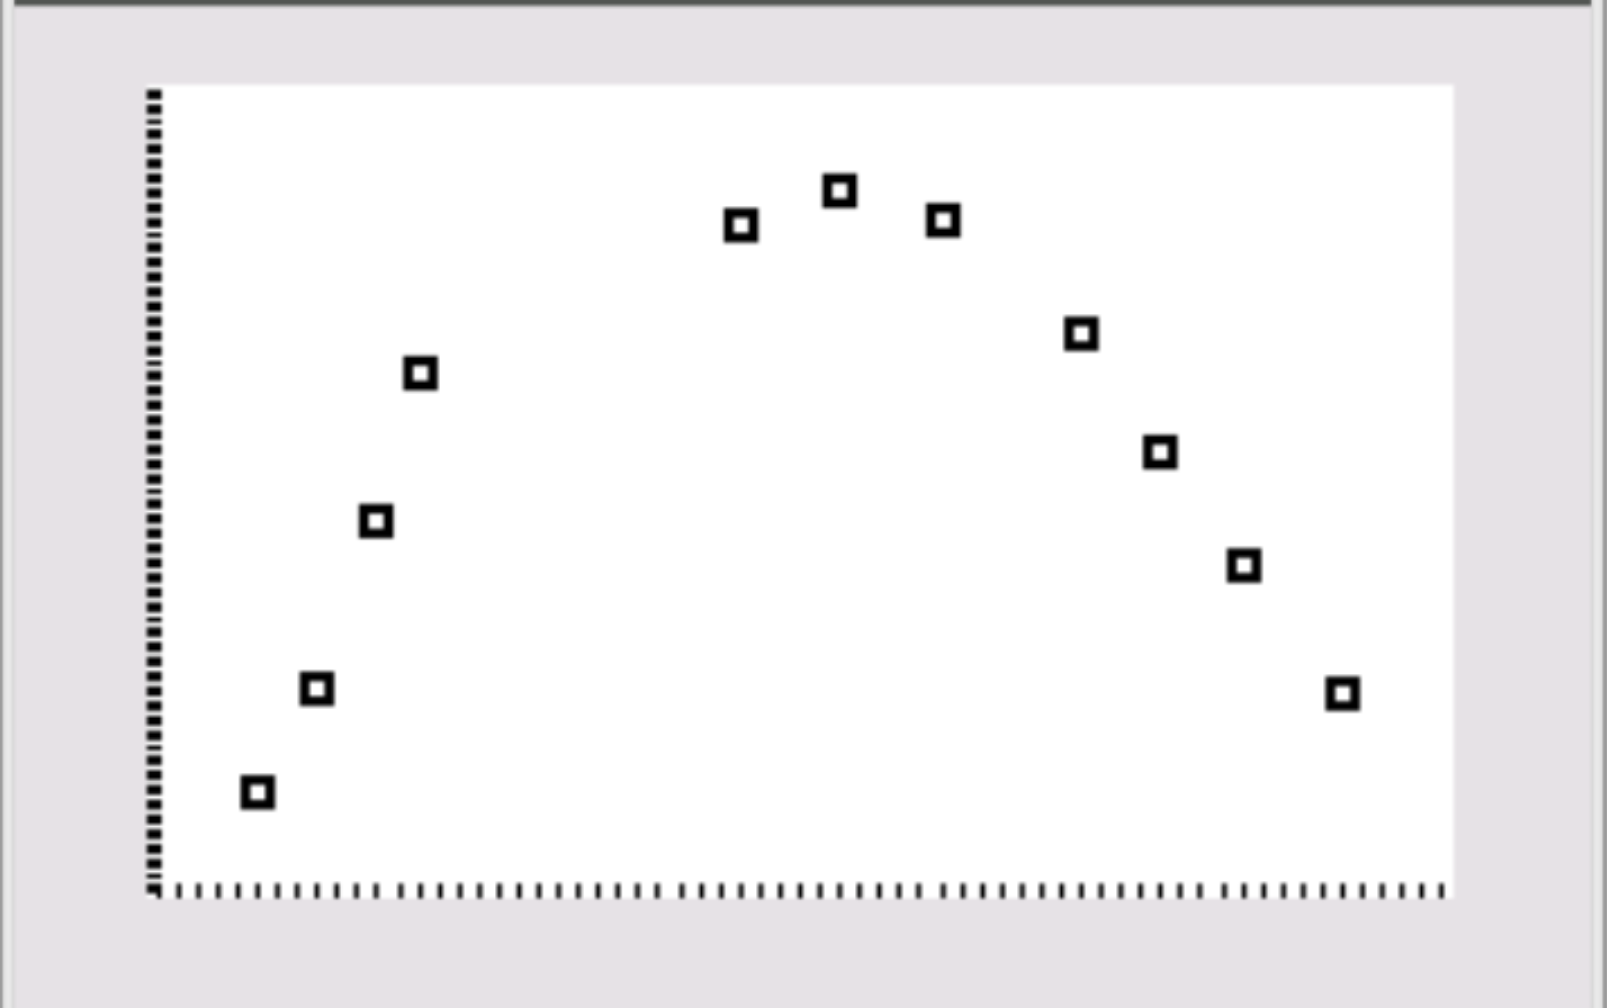
We can see that happiness tends to increase as number of hours worked increases from zero up to a certain point, but then begins to drop lower as the number of hours worked increases further.
This upside down “U” shape in the scatterplot indicates that there is a quadratic relationship between hours worked and happiness, which means we should use quadratic regression to quantify this relationship.
Step 2: Perform quadratic regression.
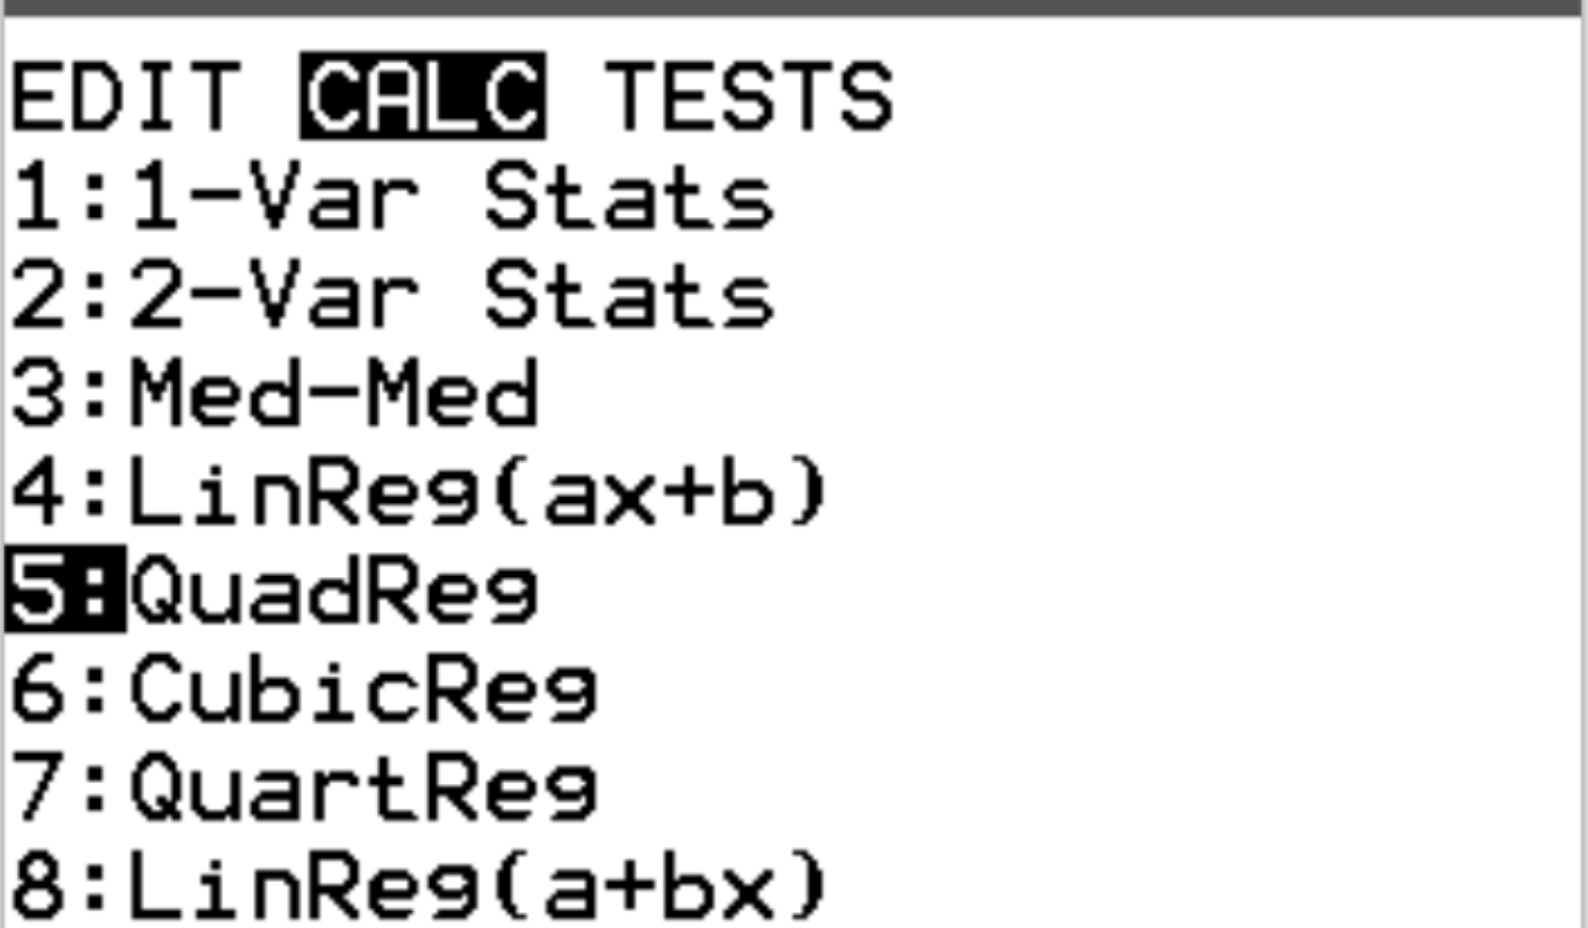
Next, we will perform quadratic regression. Press Stat and then scroll over to CALC. Then scroll down to 5: QuadReg and press Enter.
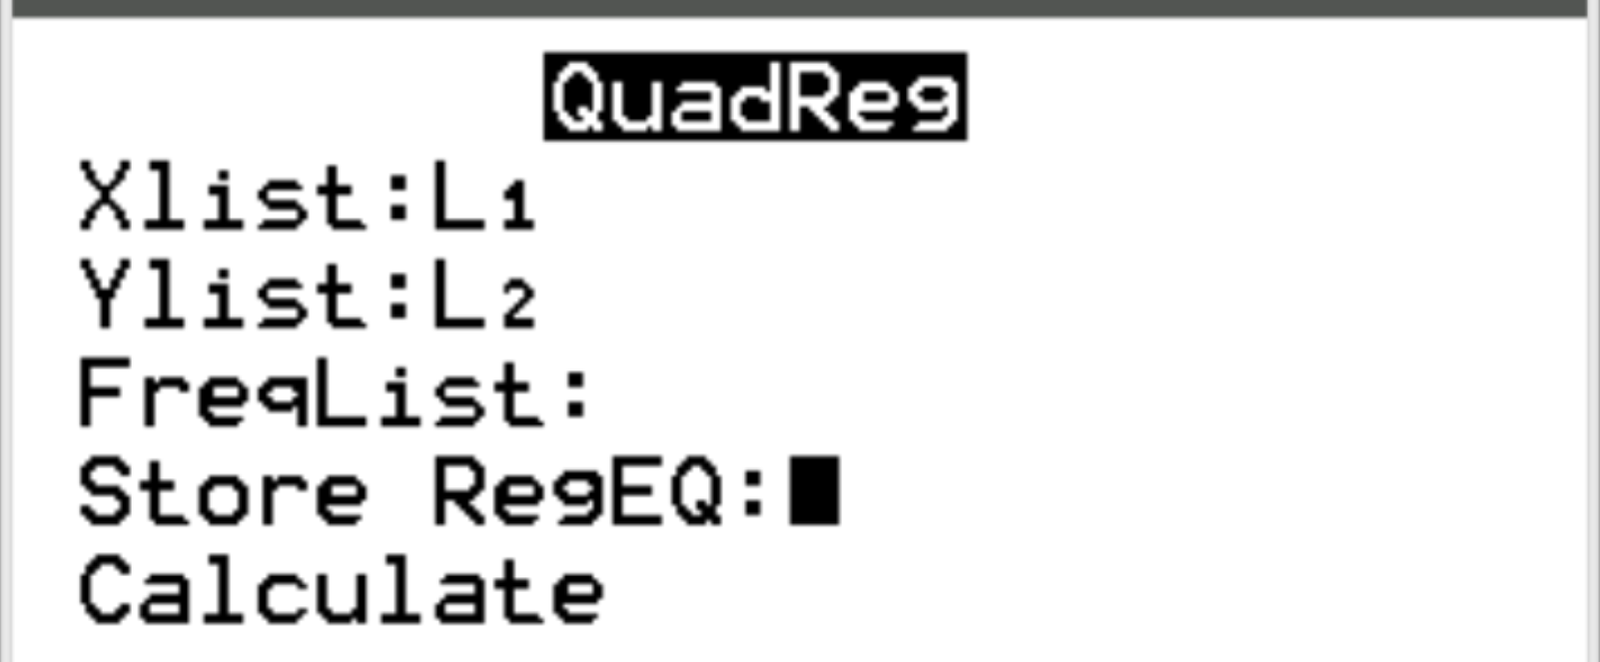
For Xlist and Ylist, make sure L1 and L2 are selected since these are the columns we used to input our data. Leave FreqList blank. Scroll down to Calculate and press Enter.
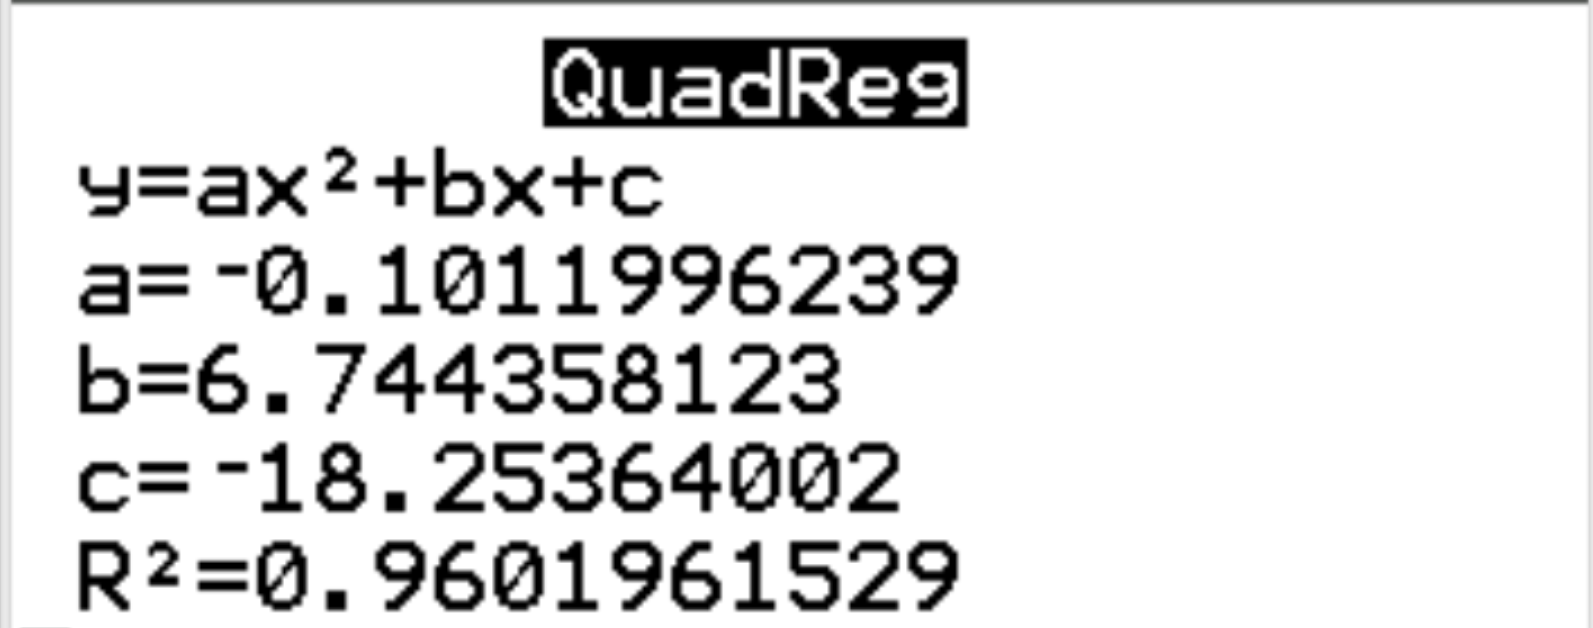
The following output will automatically appear:
Step 3: Interpret the output.
From the results, we can see that the estimated regression equation is as follows:
happiness = -0.1012(hours)2 + 6.7444(hours) – 18.2536
We can use this equation to find the predicted happiness of an individual, given the number of hours they work per week.
For example, an individual that works 60 hours per week is predicted to have a happiness level of 22.09:
happiness = -0.1012(60)2 + 6.7444(60) – 18.2536 = 22.09
Conversely, an individual that works 30 hours perk week is predicted to have a happiness level of 92.99:
happiness = -0.1012(30)2 + 6.7444(30) – 18.2536 = 92.99
We can also see that the r-squared for the regression model is r2 = 0.9602. This is the proportion of the variance in the response variable that can be explained by the explanatory variables. In this example, 96.02% of the variation in happiness can be explained by hours and hours2.