A partial F-test is used to determine whether or not there is a statistically significant difference between a regression model and some nested version of the same model.
A nested model is simply one that contains a subset of the predictor variables in the overall regression model.
For example, suppose we have the following regression model with four predictor variables:
Y = β0 + β1x1 + β2x2 + β3x3 + β4x4 + ε
One example of a nested model would be the following model with only two of the original predictor variables:
Y = β0 + β1x1 + β2x2 + ε
To determine if these two models are significantly different, we can perform a partial F-test, which calculates the following F test statistic:
F = ((RSSreduced – RSSfull)/p) / (RSSfull/n-k)
where:
- RSSreduced: The residual sum of squares of the reduced (i.e. “nested”) model.
- RSSfull: The residual sum of squares of the full model.
- p: The number of predictors removed from the full model.
- n: The total observations in the dataset.
- k: The number of coefficients (including the intercept) in the full model.
This test uses the following null and alternative hypotheses:
H0: All coefficients removed from the full model are zero.
HA: At least one of the coefficients removed from the full model is non-zero.
If the p-value corresponding to the F test-statistic is below a certain significance level (e.g. 0.05), then we can reject the null hypothesis and conclude that at least one of the coefficients removed from the full model is significant.
The following example shows how to perform a partial F-test in Excel.
Example: Partial F-Test in Excel
Suppose we have the following dataset in Excel:

Suppose we would like to determine if there is a difference between the following two regression models:
Full Model: y = β0 + β1x1 + β2x2 + β3x3 + β4x4
Reduced Model: y = β0 + β1x1 + β2x2
We can proceed to perform multiple linear regression in Excel for each model to get the following output:
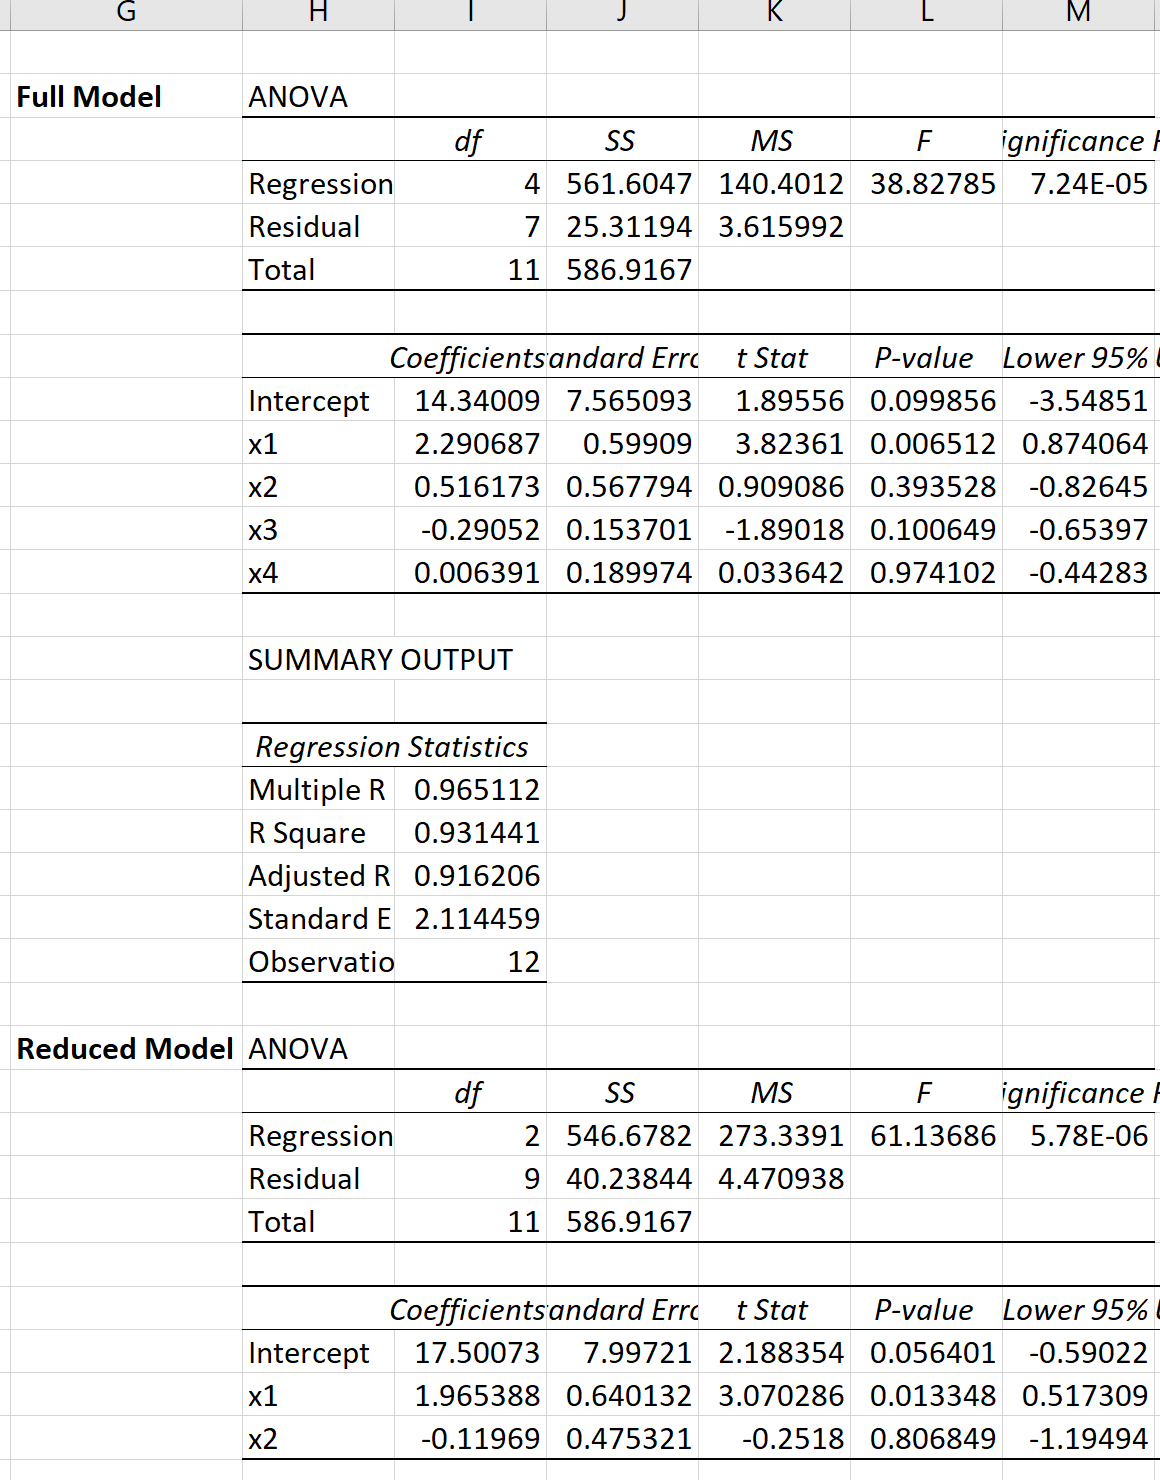
We can then use the following formula to calculate the F test-statistic for the partial F-test:

The test statistic turns out to be 2.064.
We can then use the following formula to calculate the corresponding p-value:

The p-value turns out to be 0.1974.
Since this p-value is not less than .05, we will fail to reject the null hypothesis. This means we don’t have sufficient evidence to say that either of the predictor variables x3 or x4 are statistically significant.
In other words, adding x3 and x4 to the regression model do not significantly improve the fit of the model.
Additional Resources
How to Perform Simple Linear Regression in Excel
How to Perform Multiple Linear Regression in Excel
How to Calculate the Standard Error of Regression in Excel