To draw arrows in Matplotlib, you can use the matplotlib.pyplot.arrow function, which uses the following syntax:
matplotlib.pyplot.arrow(x, y, dx, dy)
where:
- x, y: The x and y coordinates of the arrow base
- dx, dy: The length of the arrow along the x and y direction
This tutorial provides several examples of how to use this function in practice.
Example 1: Draw a Single Arrow
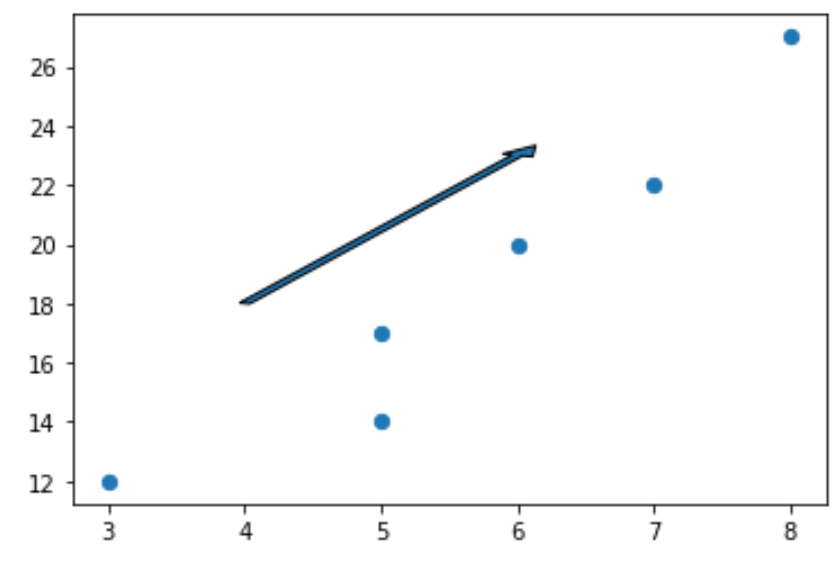
The following code shows how to draw a single arrow on a Matplotlib plot:
import matplotlib.pyplot as plt

#define two arrays for plotting
A = [3, 5, 5, 6, 7, 8]
B = [12, 14, 17, 20, 22, 27]

#create scatterplot, specifying marker size to be 40
plt.scatter(A, B, s=40)

#add arrow to plot
plt.arrow(x=4, y=18, dx=2, dy=5, width=.08)

#display plot
plt.show()
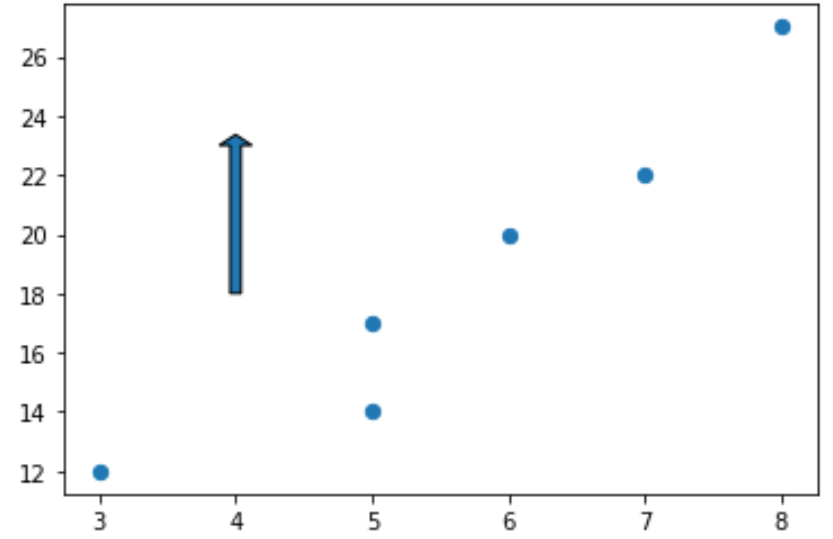
Note that we can set dx=0 to create a vertical arrow and dy=0 to create a horizontal arrow.
For example, here’s how to create a vertical arrrow:
import matplotlib.pyplot as plt

#define two arrays for plotting
A = [3, 5, 5, 6, 7, 8]
B = [12, 14, 17, 20, 22, 27]

#create scatterplot, specifying marker size to be 40
plt.scatter(A, B, s=40)

#add arrow to plot
plt.arrow(x=4, y=18, dx=0, dy=5, width=.08)

#display plot
plt.show()
Example 2: Style an Arrow
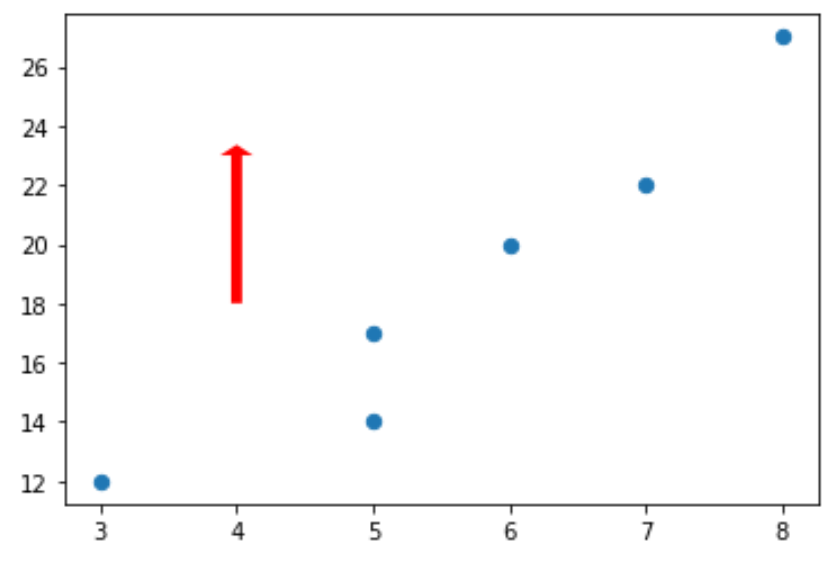
By default, an arrow in Matplotlib is blue with black edges but we can easily change this by using the facecolor and edgecolor arguments:
import matplotlib.pyplot as plt

#define two arrays for plotting
A = [3, 5, 5, 6, 7, 8]
B = [12, 14, 17, 20, 22, 27]

#create scatterplot, specifying marker size to be 40
plt.scatter(A, B, s=40)

#add arrow to plot
plt.arrow(x=4, y=18, dx=0, dy=5, width=.08, facecolor='red', edgecolor='none')

#display plot
plt.show()
You can find a complete list of styling properties that can be applied to arrows here.
Example 3: Add Annotations to Arrows
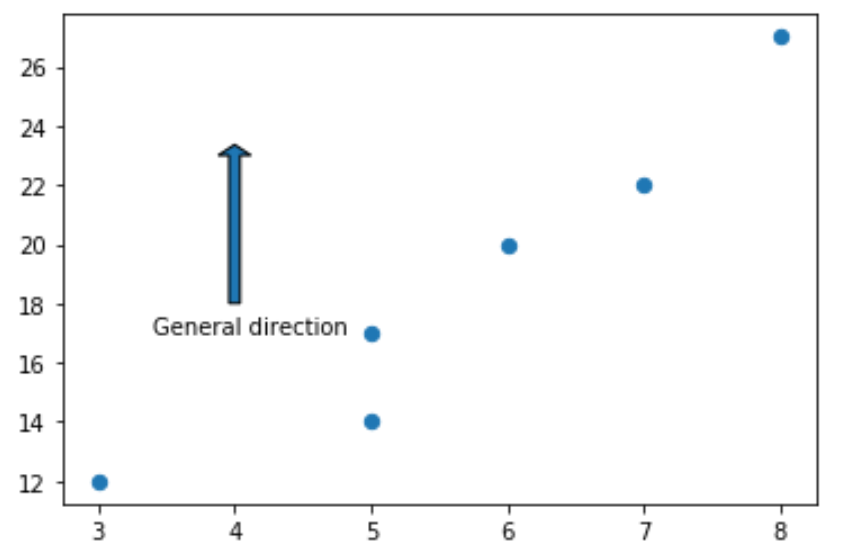
The following code shows how to add an annotation underneath an arrow on a Matplotlib plot:
import matplotlib.pyplot as plt

#define two arrays for plotting
A = [3, 5, 5, 6, 7, 8]
B = [12, 14, 17, 20, 22, 27]

#create scatterplot, specifying marker size to be 40
plt.scatter(A, B, s=40)

#add arrow to plot
plt.arrow(x=4, y=18, dx=0, dy=5, width=.08)

#add annotation
plt.annotate('General direction', xy = (3.4, 17))

#display plot
plt.show()
Additional Resources
How to Plot Circles in Matplotlib (With Examples)
How to Draw Rectangles in Matplotlib (With Examples)