To draw a rectangle in Matplotlib, you can use the matplotlib.patches.Rectangle function, which uses the following syntax:
matplotlib.patches.Rectangle(xy, width, height, angle=0.0)
where:
- xy: The (x, y) coordinates for the anchor point of the rectangle
- width: Rectangle width
- height: Rectangle height
- angle: Rotation in degrees counter-clockwise about xy (Default is 0)
This tutorial provides several examples of how to use this function in practice.
Example 1: Draw a Rectangle on a Plot
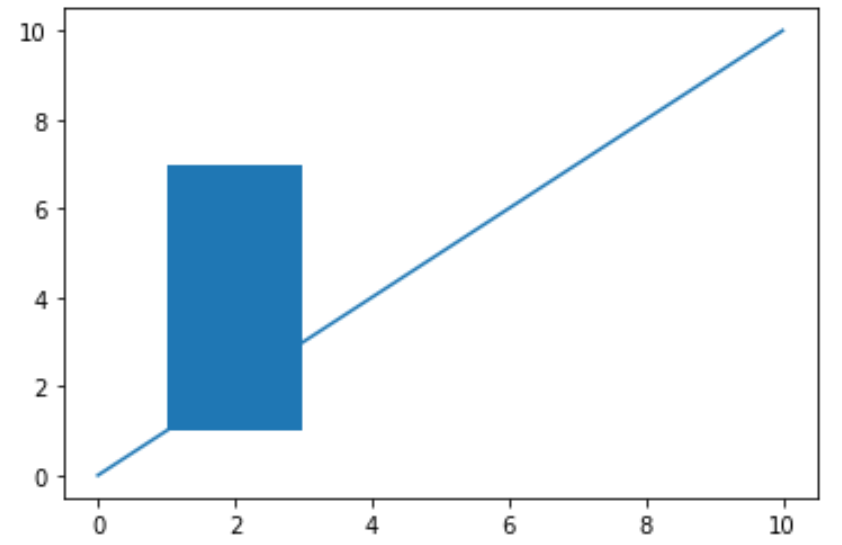
The following code shows how to draw a rectangle on a Matplotlib plot with a width of 2 and height of 6:
import matplotlib.pyplot as plt
from matplotlib.patches import Rectangle

#define Matplotlib figure and axis
fig, ax = plt.subplots()

#create simple line plot
ax.plot([0, 10],[0, 10])

#add rectangle to plot
ax.add_patch(Rectangle((1, 1), 2, 6))

#display plot
plt.show()
Example 2: Style a Rectangle
The following code shows how to apply some styling to the rectangle:
import matplotlib.pyplot as plt
from matplotlib.patches import Rectangle

#define Matplotlib figure and axis
fig, ax = plt.subplots()

#create simple line plot
ax.plot([0, 10],[0, 10])

#add rectangle to plot
ax.add_patch(Rectangle((1, 1), 2, 6,
             edgecolor = 'pink',
             facecolor = 'blue',
             fill=True,
             lw=5))

#display plot
plt.show()
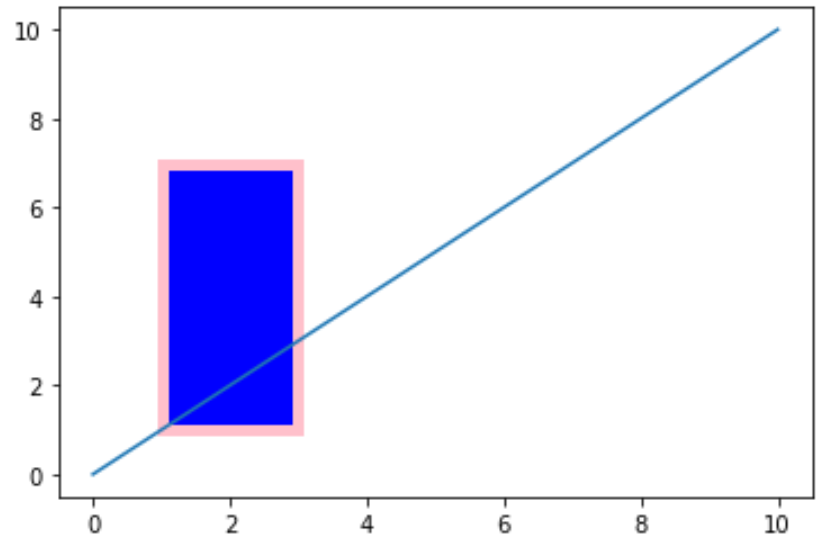
You can find a complete list of styling properties that you can apply to a rectangle here.
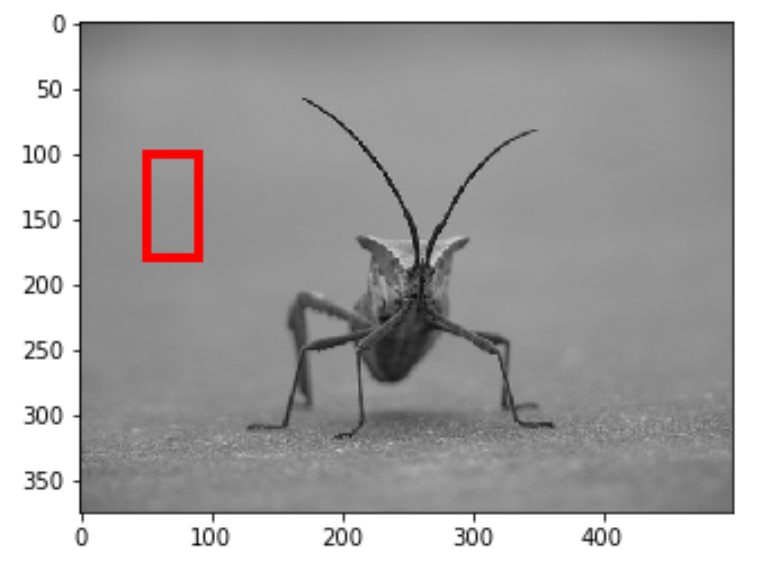
Example 3: Draw a Rectangle on an Image
The following code shows how to draw a rectangle on an image in Matplotilb. Note that the image used in this example comes from this Matplotlib tutorial.
To replicate this example, just download the photo of the stinkbug from that tutorial and save it to your own computer.
import matplotlib.pyplot as plt
from matplotlib.patches import Rectangle
from PIL import Image

#display the image
plt.imshow(Image.open('stinkbug.png'))

#add rectangle
plt.gca().add_patch(Rectangle((50,100),40,80,
                    edgecolor='red',
                    facecolor='none',
                    lw=4))
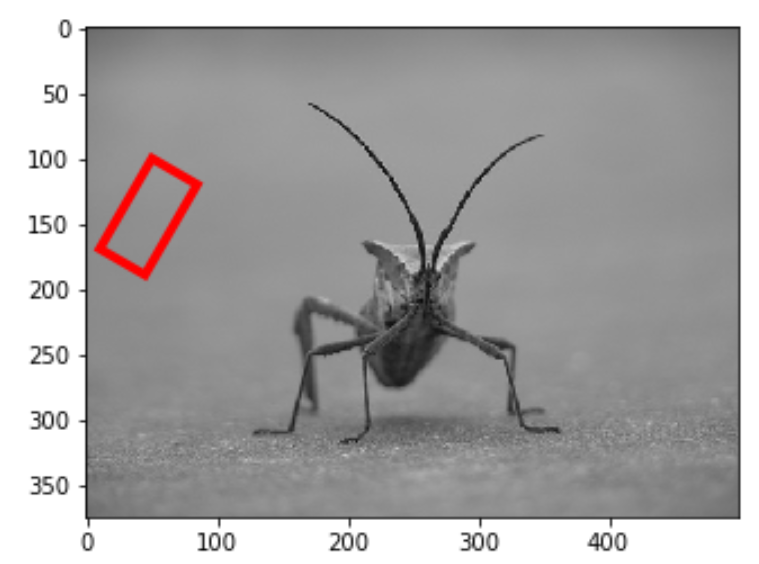
Note that we can use the angle argument to rotate the rectangle a certain number of degrees counter-clockwise:
import matplotlib.pyplot as plt
from matplotlib.patches import Rectangle
from PIL import Image

#display the image
plt.imshow(Image.open('stinkbug.png'))

#add rectangle
plt.gca().add_patch(Rectangle((50,100),40,80,
                    angle=30,
                    edgecolor='red',
                    facecolor='none',
                    lw=4))