Cramer’s V is a measure of the strength of association between two nominal variables.
It ranges from 0 to 1 where:
- 0 indicates no association between the two variables.
- 1 indicates a perfect association between the two variables.
It is calculated as:
Cramer’s V = √(X2/n) / min(c-1, r-1)
where:
- X2: The Chi-square statistic
- n: Total sample size
- r: Number of rows
- c: Number of columns
How to Interpret Cramer’s V
The following table shows how to interpret Cramer’s V based on the degrees of freedom:
| Degrees of freedom | Small | Medium | Large |
|---|---|---|---|
| 1 | 0.10 | 0.30 | 0.50 |
| 2 | 0.07 | 0.21 | 0.35 |
| 3 | 0.06 | 0.17 | 0.29 |
| 4 | 0.05 | 0.15 | 0.25 |
| 5 | 0.04 | 0.13 | 0.22 |
The following examples show how to interpret Cramer’s V in different situations.
Example 1: Interpreting Cramer’s V for 2×3 Table
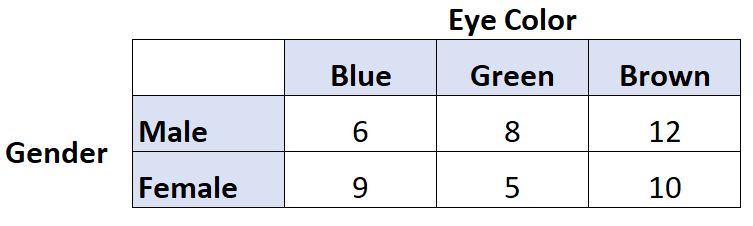
Suppose we want to know if there is an association between eye color and gender so we survey 50 individuals and obtain the following results:
We can use the following code in R to calculate Cramer’s V for these two variables:
library(rcompanion)

#create table
data = matrix(c(6, 9, 8, 5, 12, 10), nrow=2)

#view table
data

     [,1] [,2] [,3]
[1,]    6    8   12
[2,]    9    5   10

#calculate Cramer's V
cramerV(data)

Cramer V
  0.1671
Cramer’s V turns out to be 0.1671.
The degrees of freedom would be calculated as:
- df = min(#rows-1, #columns-1)
- df = min(1, 2)
- df = 1
Referring to the table above, we can see that a Cramer’s V of 0.1671 and degrees of freedom = 1 indicates a small (or “weak”) association between eye color and gender.
Example 2: Interpreting Cramer’s V for 3×3 Table
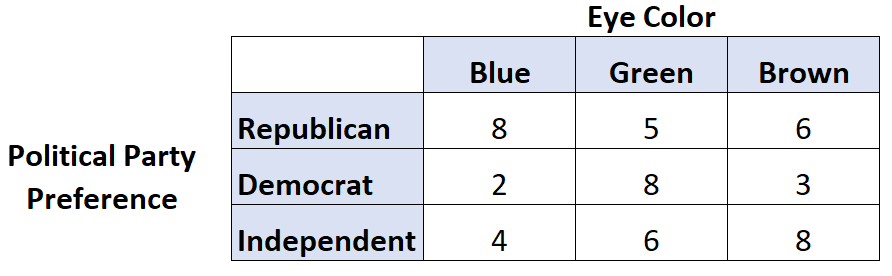
Suppose we want to know if there is an association between eye color and political party preference so we survey 50 individuals and obtain the following results:
We can use the following code in R to calculate Cramer’s V for these two variables:
library(rcompanion)

#create table
data = matrix(c(8, 2, 4, 5, 8, 6, 6, 3, 8), nrow=3)

#view table
data

     [,1] [,2] [,3]
[1,]    8    5    6
[2,]    2    8    3
[3,]    4    6    8

#calculate Cramer's V
cramerV(data)

Cramer V
  0.246
Cramer’s V turns out to be 0.246.
The degrees of freedom would be calculated as:
- df = min(#rows-1, #columns-1)
- df = min(2, 2)
- df = 2
Referring to the table above, we can see that a Cramer’s V of 0.246 and degrees of freedom = 2 indicates a medium (or “moderate”) association between eye color and political party preference.
Additional Resources
The following tutorials explain how to calculate Cramer’s V in different statistical software:
How to Calculate Cramer’s V in Excel
How to Calculate Cramer’s V in R
How to Calculate Cramer’s V in Python