A boxplot (sometimes called a box-and-whisker plot) is a plot that shows the five-number summary of a dataset, which includes the following values:
- Minimum
- First Quartile
- Median
- Third Quartile
- Maximum
To create a horizontal boxplot in base R, we can use the following code:
#create one horizontal boxplot
boxplot(df$values, horizontal=TRUE)

#create several horizontal boxplots by group
boxplot(values~group, data=df, horizontal=TRUE)
And to create a horizontal boxplot in ggplot2, we can use the following code:
#create one horizontal boxplot
ggplot(df, aes(y=values)) +
  geom_boxplot() +
  coord_flip()
#create several horizontal boxplots by group
ggplot(df, aes(x=group, y=values)) +
  geom_boxplot() +
  coord_flip()
The following examples show how to create horizontal boxplots in both base R and ggplot2.
Example 1: Horizontal Boxplots in Base R
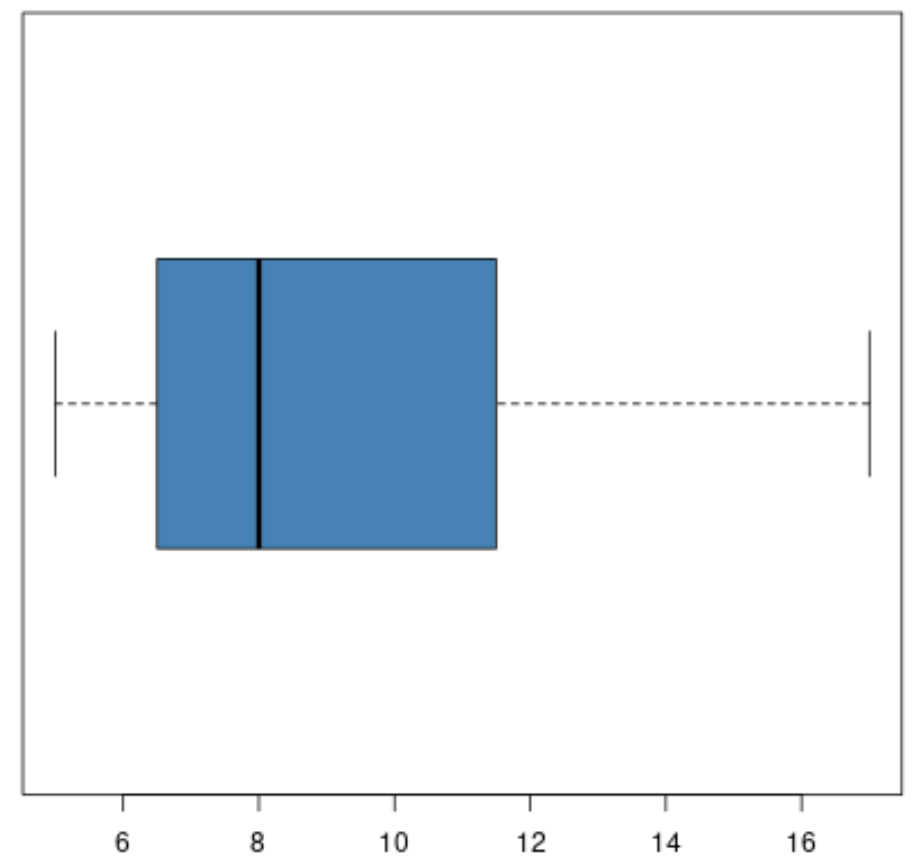
The following code shows how to create a horizontal boxplot for one variable in a data frame in R:
#create data
df frame(points=c(7, 8, 9, 12, 12, 5, 6, 6, 8, 11, 6, 8, 9, 13, 17),
                 team=rep(c('A', 'B', 'C'), each=5))

#create horizontal boxplot for points
boxplot(df$points, horizontal=TRUE, col='steelblue')
The following code shows how to create several horizontal boxplots based on groups:
#create data
df frame(points=c(7, 8, 9, 12, 12, 5, 6, 6, 8, 11, 6, 8, 9, 13, 17),
                 team=rep(c('A', 'B', 'C'), each=5))

#create horizontal boxplots grouped by team
boxplot(points~team, data=df, horizontal=TRUE, col='steelblue', las=2)
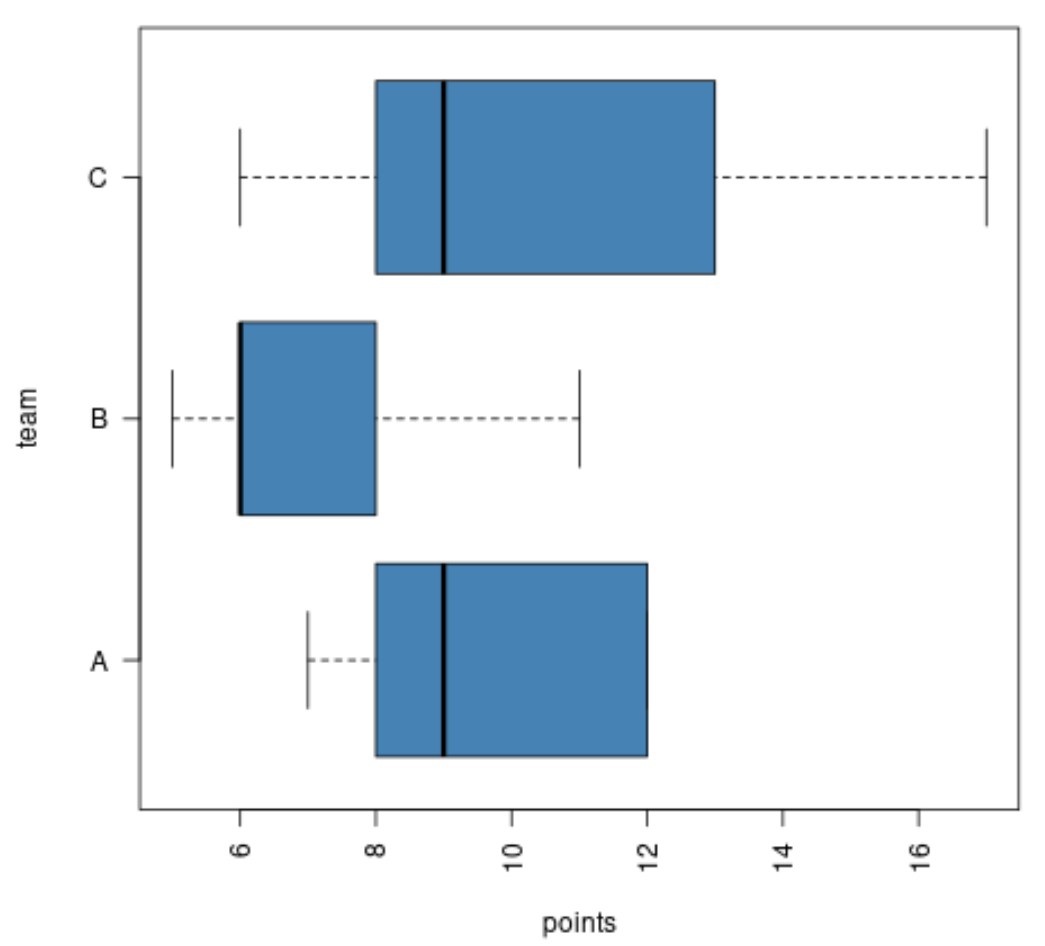
Note that the argument las=2 tells R to make the y-axis labels perpendicular to the axis.
Example 2: Horizontal Boxplots in ggplot2
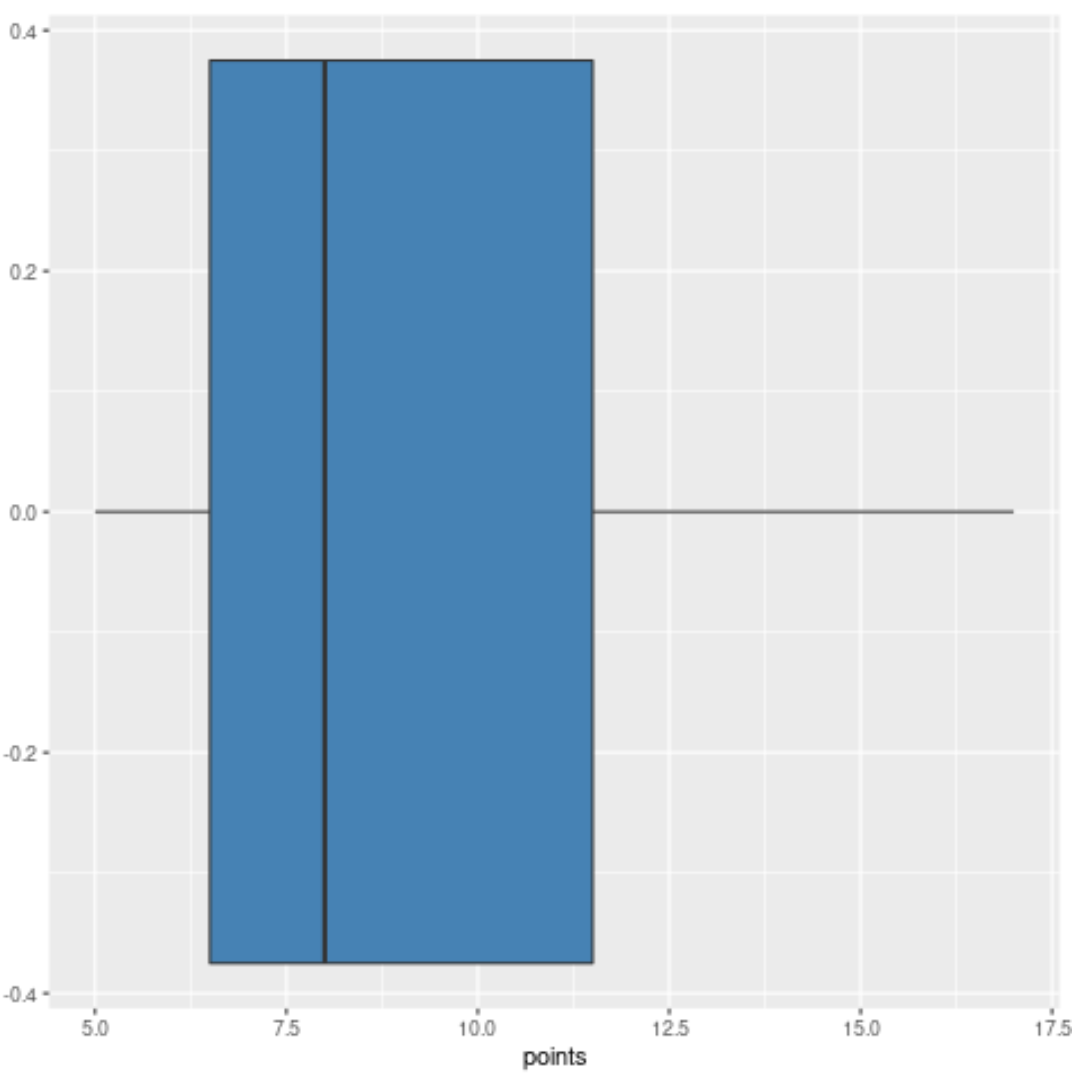
The following code shows how to create a horizontal boxplot for one variable in ggplot2:
library(ggplot2)

#create data
df frame(points=c(7, 8, 9, 12, 12, 5, 6, 6, 8, 11, 6, 8, 9, 13, 17),
                 team=rep(c('A', 'B', 'C'), each=5))

#create horizontal boxplot for points
ggplot(df, aes(y=points)) +
  geom_boxplot(fill='steelblue') +
  coord_flip()
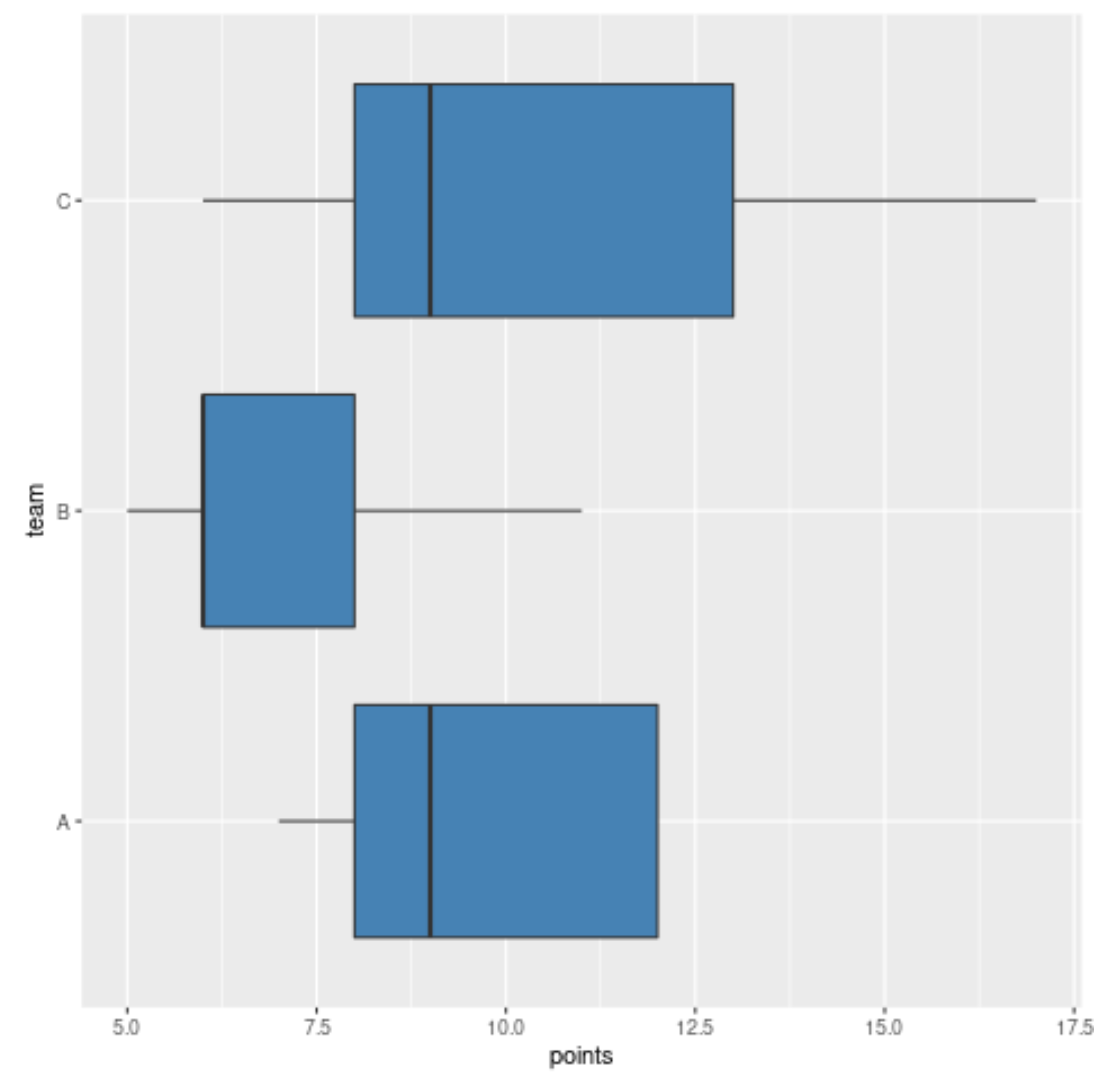
The following code shows how to create several horizontal boxplots in ggplot2 based on groups:
library(ggplot2)

#create data
df frame(points=c(7, 8, 9, 12, 12, 5, 6, 6, 8, 11, 6, 8, 9, 13, 17),
                 team=rep(c('A', 'B', 'C'), each=5))

#create horizontal boxplot for points
ggplot(df, aes(x=team, y=points)) +
  geom_boxplot(fill='steelblue') +
  coord_flip()
Additional Resources
How to Create a Strip Chart in R
How to Create a Stacked Barplot in R
How to Create a Stacked Dot Plot in R