You can use the following basic syntax to plot a line of best fit in Python:
#find line of best fit
a, b = np.polyfit(x, y, 1)

#add points to plot
plt.scatter(x, y)

#add line of best fit to plot
plt.plot(x, a*x+b)
The following example shows how to use this syntax in practice.
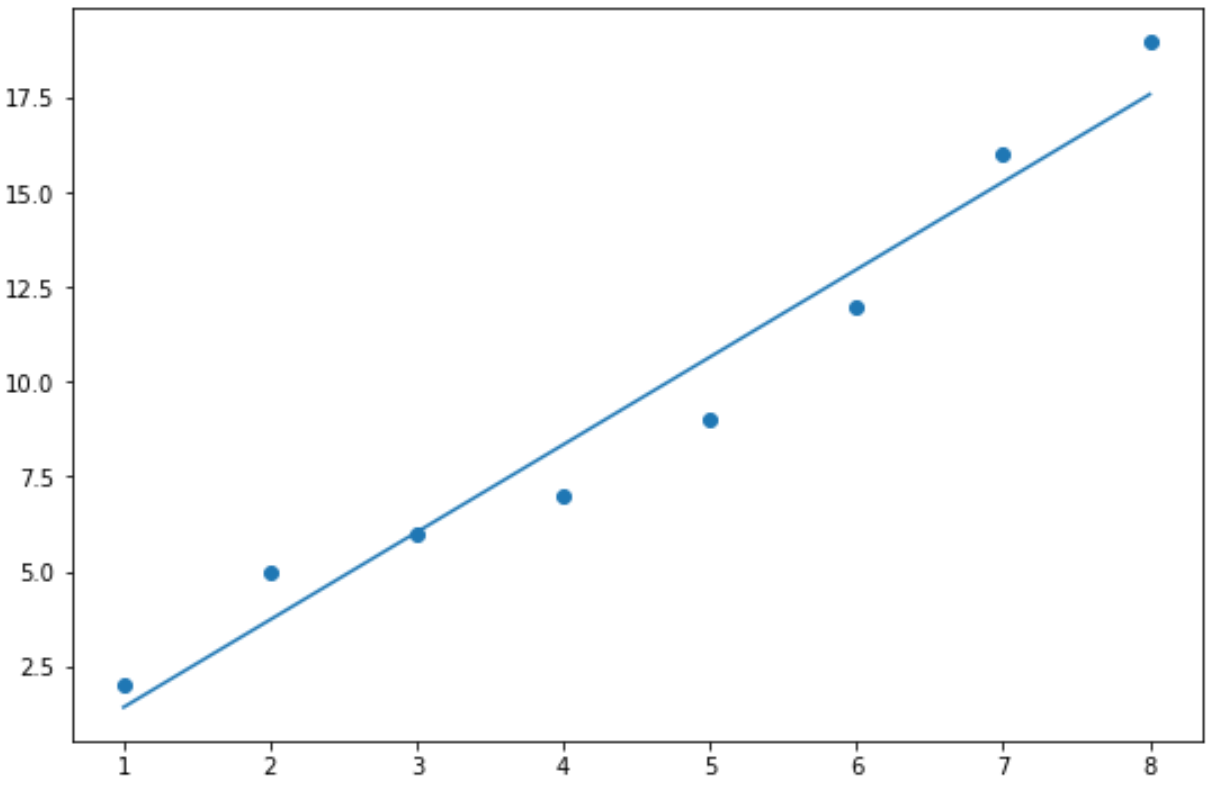
Example 1: Plot Basic Line of Best Fit in Python
The following code shows how to plot a basic line of best fit in Python:
import numpy as np
import matplotlib.pyplot as plt

#define data
x = np.array([1, 2, 3, 4, 5, 6, 7, 8])
y = np.array([2, 5, 6, 7, 9, 12, 16, 19])

#find line of best fit
a, b = np.polyfit(x, y, 1)

#add points to plot
plt.scatter(x, y)

#add line of best fit to plot
plt.plot(x, a*x+b)
Example 2: Plot Custom Line of Best Fit in Python
The following code shows how to create the same line of best fit as the previous example except with the following additions:
- Customized colors for the points and the line of best fit
- Customized style and width for the line of best fit
- The equation of the fitted regression line displayed on the plot
import numpy as np
import matplotlib.pyplot as plt

#define data
x = np.array([1, 2, 3, 4, 5, 6, 7, 8])
y = np.array([2, 5, 6, 7, 9, 12, 16, 19])

#find line of best fit
a, b = np.polyfit(x, y, 1)

#add points to plot
plt.scatter(x, y, color='purple')

#add line of best fit to plot
plt.plot(x, a*x+b, color='steelblue', linestyle='--', linewidth=2)

#add fitted regression equation to plot
plt.text(1, 17, 'y = ' + '{:.2f}'.format(b) + ' + {:.2f}'.format(a) + 'x', size=14)
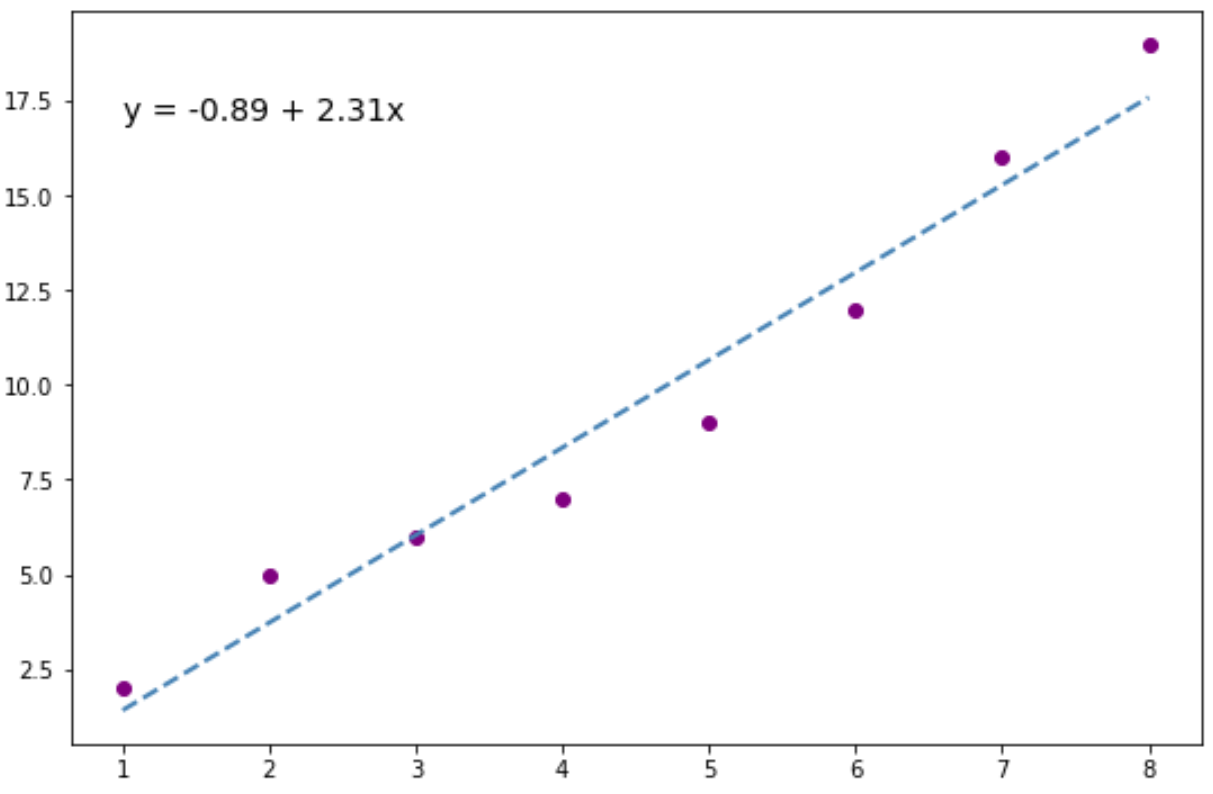
Feel free to place the fitted regression equation in whatever (x, y) coordinates you would like on the plot.
For this particular example, we chose (x, y) = (1, 17).
Additional Resources
The following tutorials explain how to fit various regression models in Python:
A Complete Guide to Linear Regression in Python
How to Perform Polynomial Regression in Python
How to Perform Quantile Regression in Python