In statistics, an odds ratio tells us the ratio of the odds of an event occurring in a treatment group compared to the odds of an event occurring in a control group.
We often calculate an odds ratio when performing an analysis on a 2-by-2 table, which takes on the following format:

To calculate an odds ratio in R, we can use the oddsratio() function from the epitools package.
The following example shows how to use this syntax in practice.
Example: Calculating an Odds Ratio in R
Suppose 50 basketball players use a new training program and 50 players use an old training program. At the end of the program we test each player to see if they pass a certain skills test.
The following table shows the number of players who passed and failed, based on the program they used:
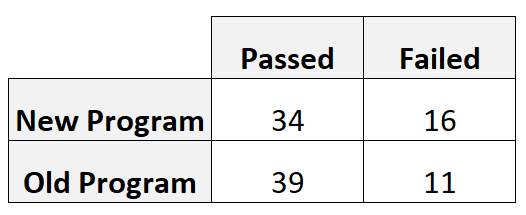
Suppose we would like to calculate an odds ratio to compare the odds of a player passing the skills test using the new program compared to using the old program.
Here is how to create this matrix in R:
#create matrix
program New Program', 'Old Program')
outcome Pass', 'Fail')
data 2, ncol=2, byrow=TRUE)
dimnames(data) Program'=program, 'Outcome'=outcome)

#view matrix
data

             Outcome
Program       Pass Fail
  New Program   34   16
  Old Program   39   11
And here is how to calculate the odds ratio using the oddsratio() function from the epitools package:
install.packages('epitools')

library(epitools)

#calculate odds ratio
oddsratio(data)

$measure
             odds ratio with 95% C.I.
Program        estimate     lower    upper
  New Program 1.0000000        NA       NA
  Old Program 0.6045506 0.2395879 1.480143

$p.value
             two-sided
Program       midp.exact fisher.exact chi.square
  New Program         NA           NA         NA
  Old Program   0.271899    0.3678219  0.2600686

$correction
[1] FALSE

attr(,"method")
[1] "median-unbiased estimate & mid-p exact CI"
The odds ratio turns out to be 0.6045506.
We would interpret this to mean that the odds that a player passes the test by using the new program are just .6045506 times the odds that a player passes the test by using the old program.
In other words, the odds that a player passes the test are actually lowered by about 39.6% by using the new program.
We can also use the values in the lower and upper columns of the output to construct the following 95% confidence interval for the odds ratio:
95% confidence interval for the odds ratio: [0.24, 1.48].
We are 95% confident that the true odds ratio between the new and old training program is contained in this interval.
The midp.exact column in the output also displays the p-value associated with the odds ratio.
This p-value turns out to be 0.271899. Since this value is not less than .05, we would conclude that the odds ratio is not statistically significant.
In other words, we know from the odds ratio that the odds of a player passing using the new program are lower than the odds of passing using the old program, but the difference between these odds is not actually statistically significant.
Additional Resources
The following tutorials provide additional information about odds ratios:
Odds Ratio vs. Relative Risk: What’s the Difference?
The Complete Guide: How to Report Odds Ratios
How to Calculate a Confidence Interval for an Odds Ratio