Many statistical tests require one or more variables to be normally distributed in order for the results of the test to be reliable.
This tutorial explains two different methods you can use to test for normality among variables in SPSS.
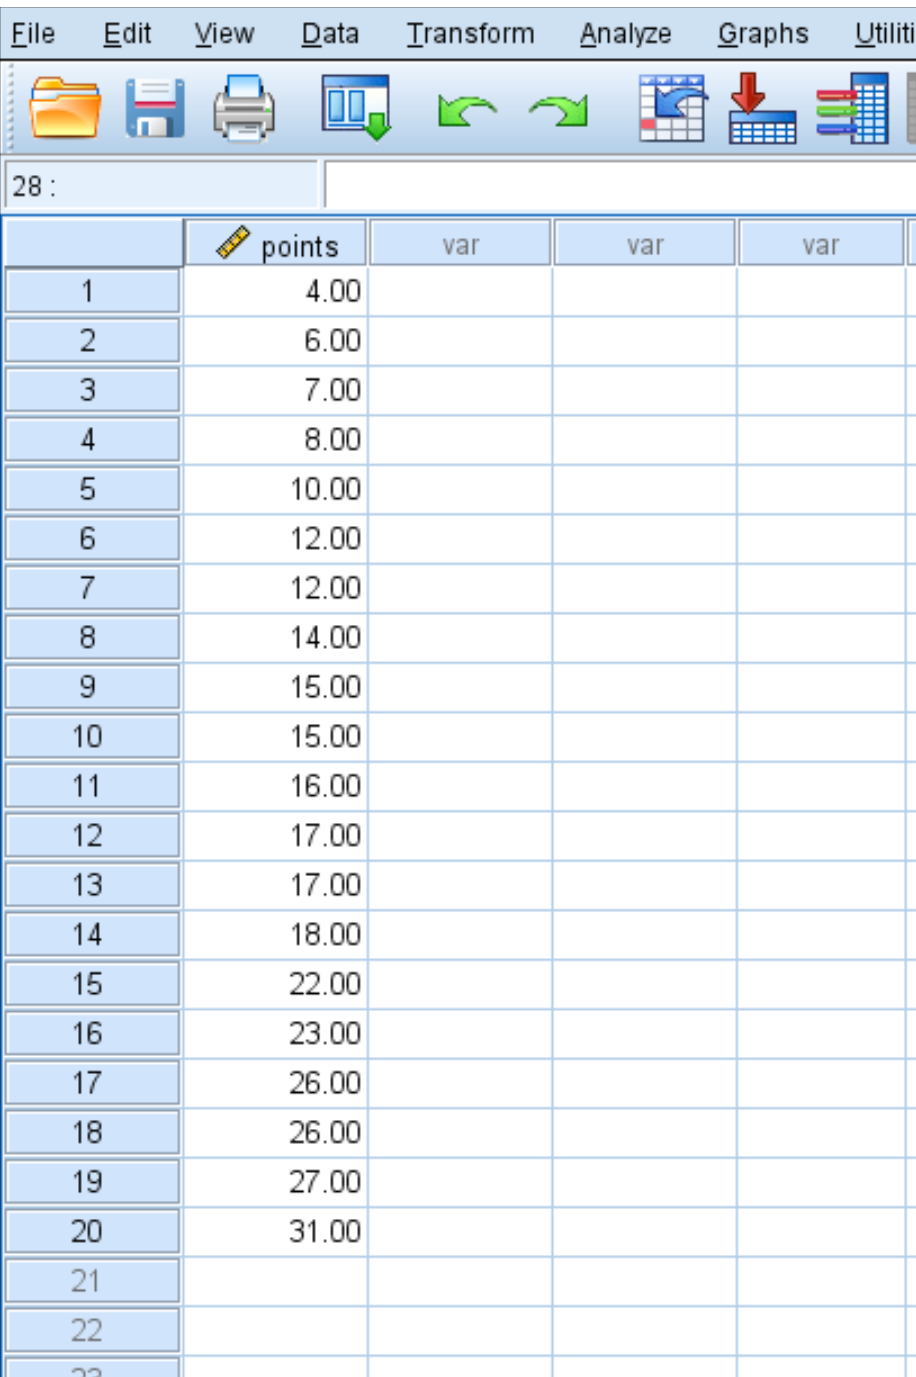
Each method will use the following dataset, which shows the average points per game scored by 20 different basketball players:
Method 1: Histograms
One way to see if a variable is normally distributed is to create a histogram to view the distribution of the variable. If the variable is normally distributed, the histogram should take on a “bell” shape with more values located near the center and fewer values located out on the tails.
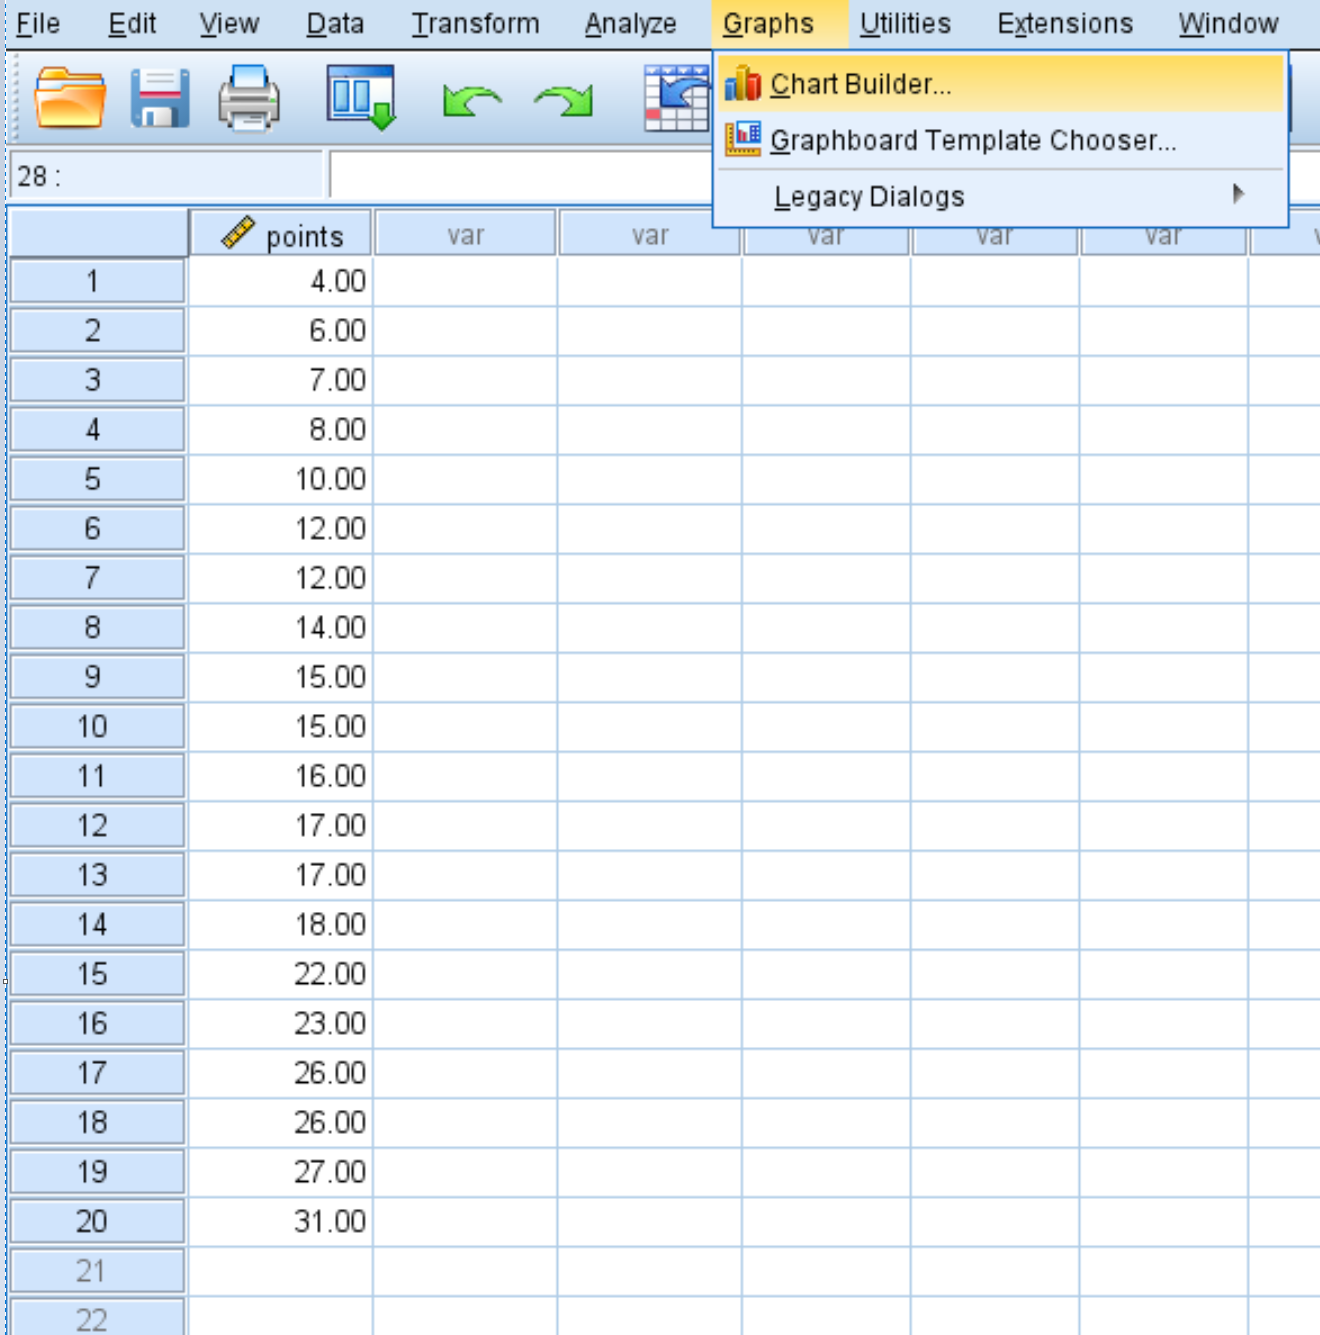
To create a histogram for this basketball dataset, we can click on the Graphs tab, then Chart Builder.
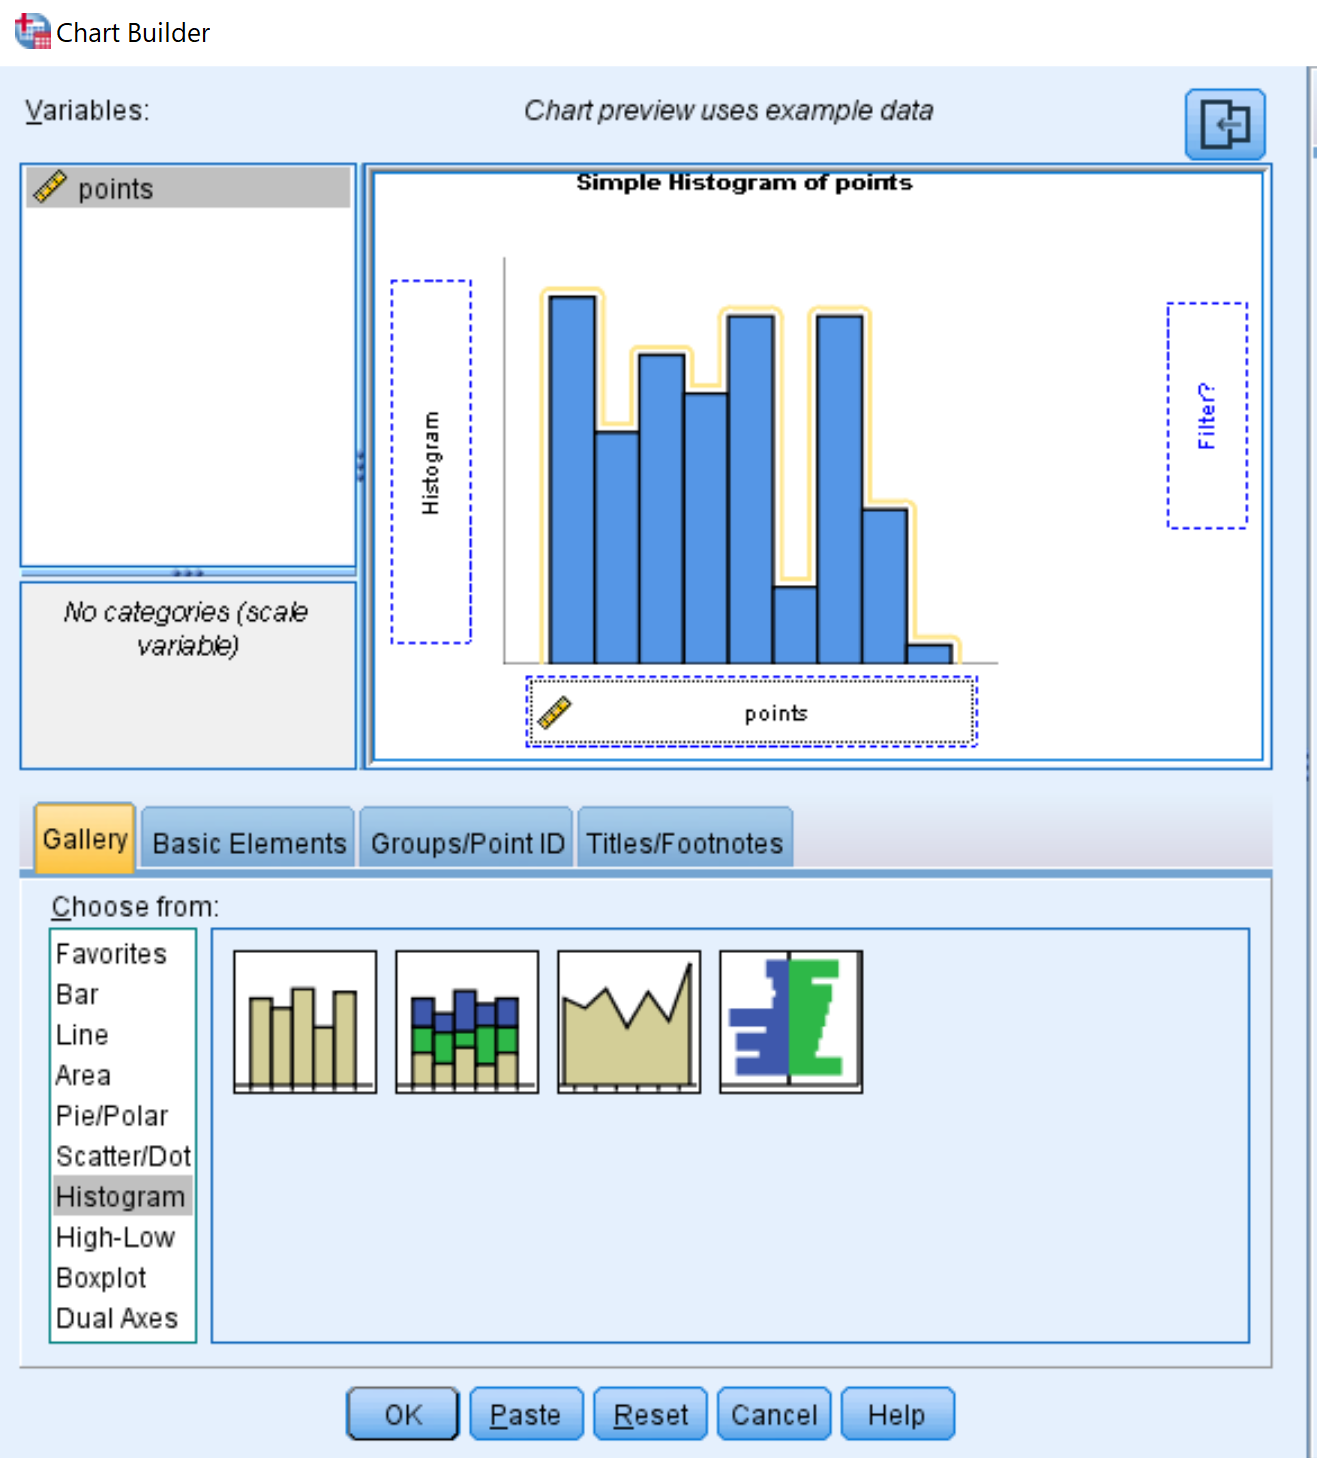
In the window that pops up, select Histogram in the Choose from list and drag it into the editing window. Then drag the variable points into the x-axis:
Once you click OK, the following histogram will appear:
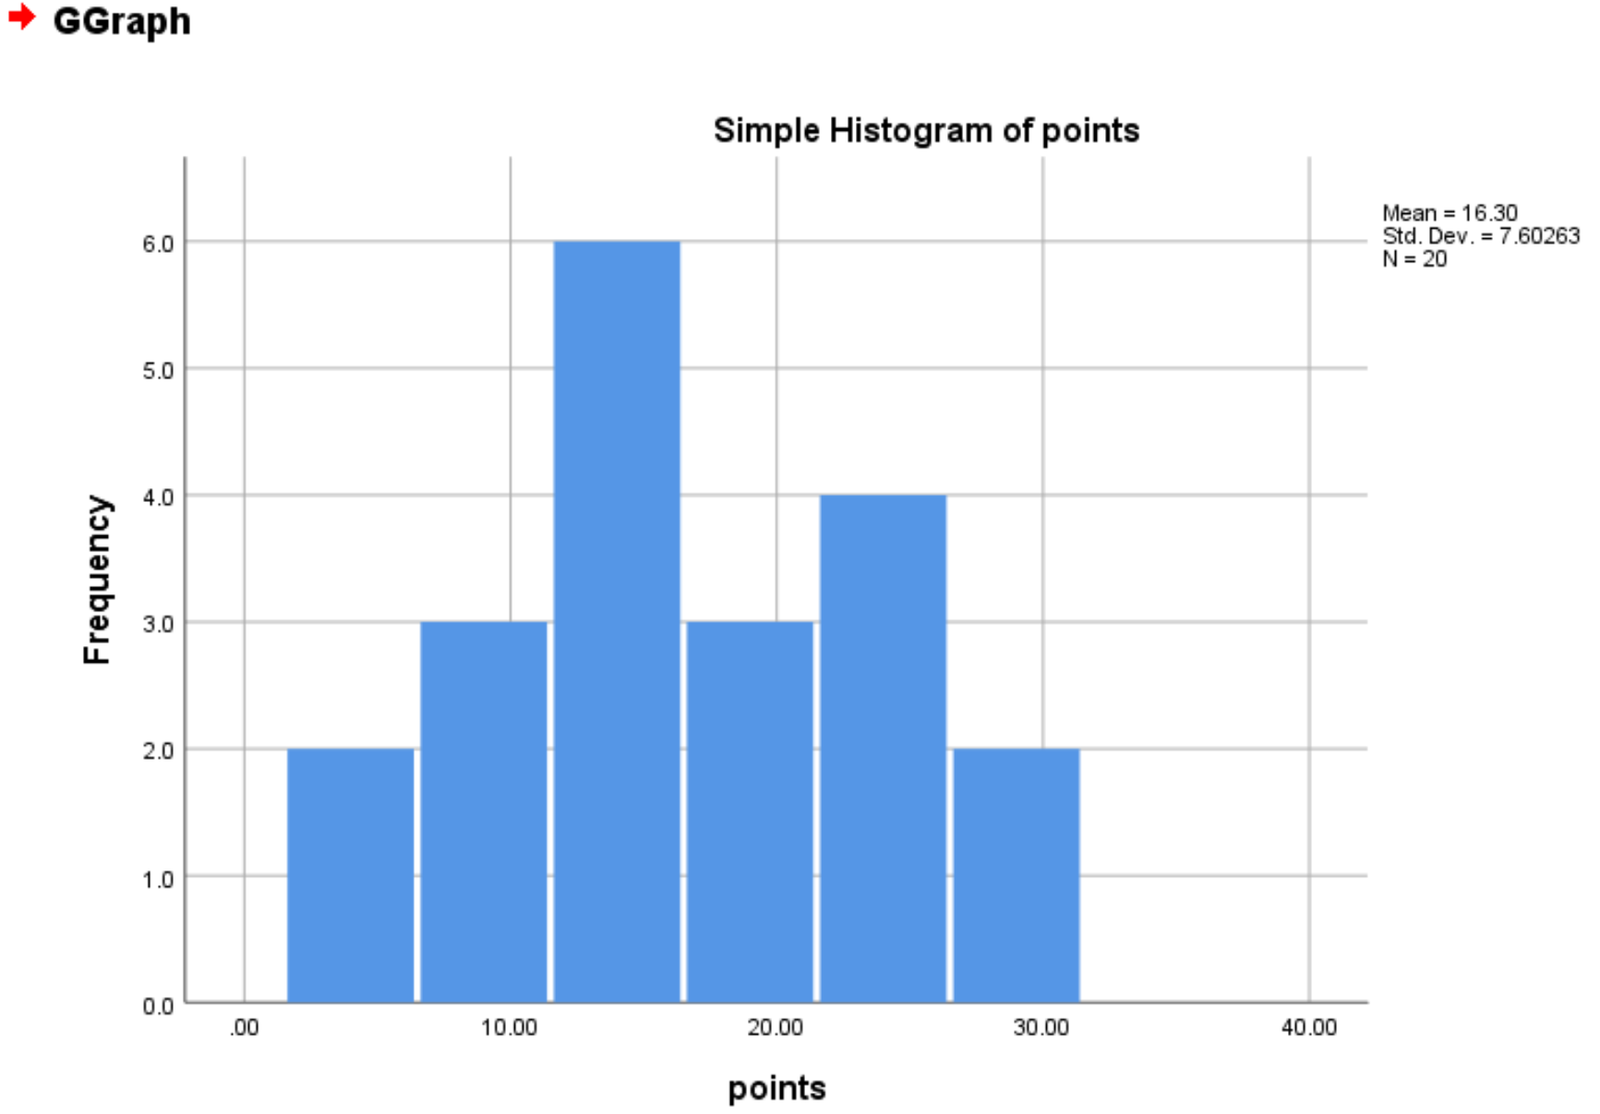
We can see that the variable points isn’t perfectly normally distributed, but it does follow roughly a bell shape with most players scoring between 10 and 20 points per game and fewer players scoring outside of this amount.
Although this isn’t a formal way to test for normality, it gives us a quick way to visualize the distribution of a variable and gives us a rough idea of whether or not the distribution is bell shaped.
Method 2: Formal Statistical Tests
We can also use formal statistical tests to determine whether or not a variable follows a normal distribution. SPSS offers the following tests for normality:
- Shapiro-Wilk Test
- Kolmogorov-Smirnov Test
The null hypothesis for each test is that a given variable is normally distributed. If the p-value of the test is less than some significance level (common choices include 0.01, 0.05, and 0.10), then we can reject the null hypothesis and conclude that there is sufficient evidence to say that the variable is not normally distributed.
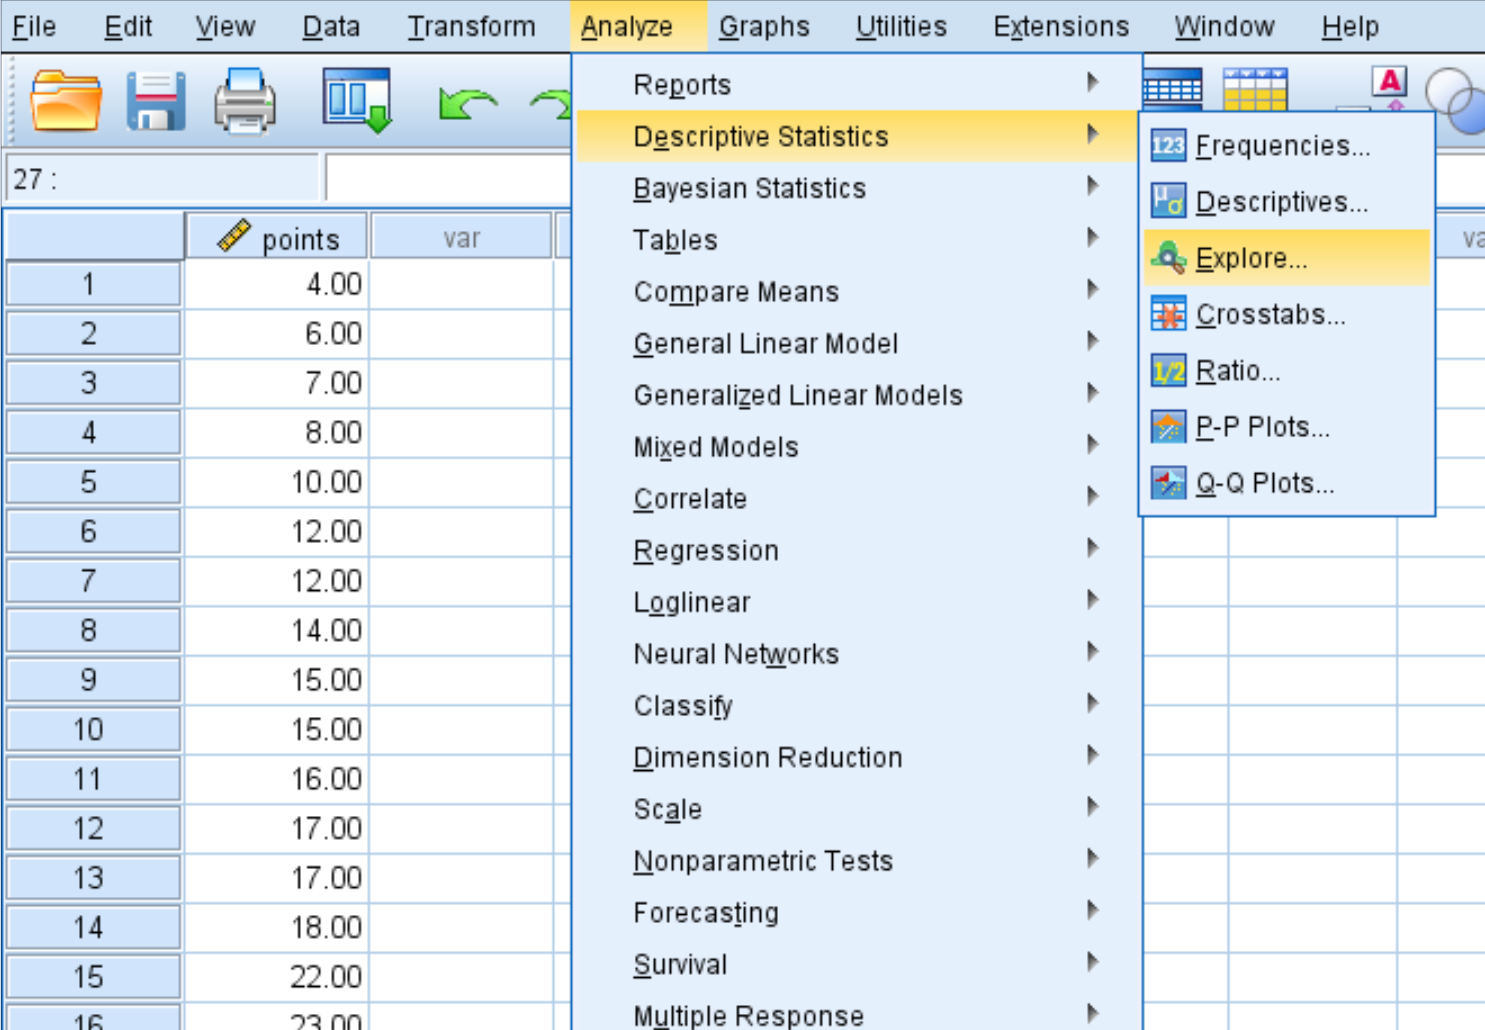
To perform both of these tests in SPSS simultaneously, click the Analyze tab, then Descriptive Statistics, then Explore:
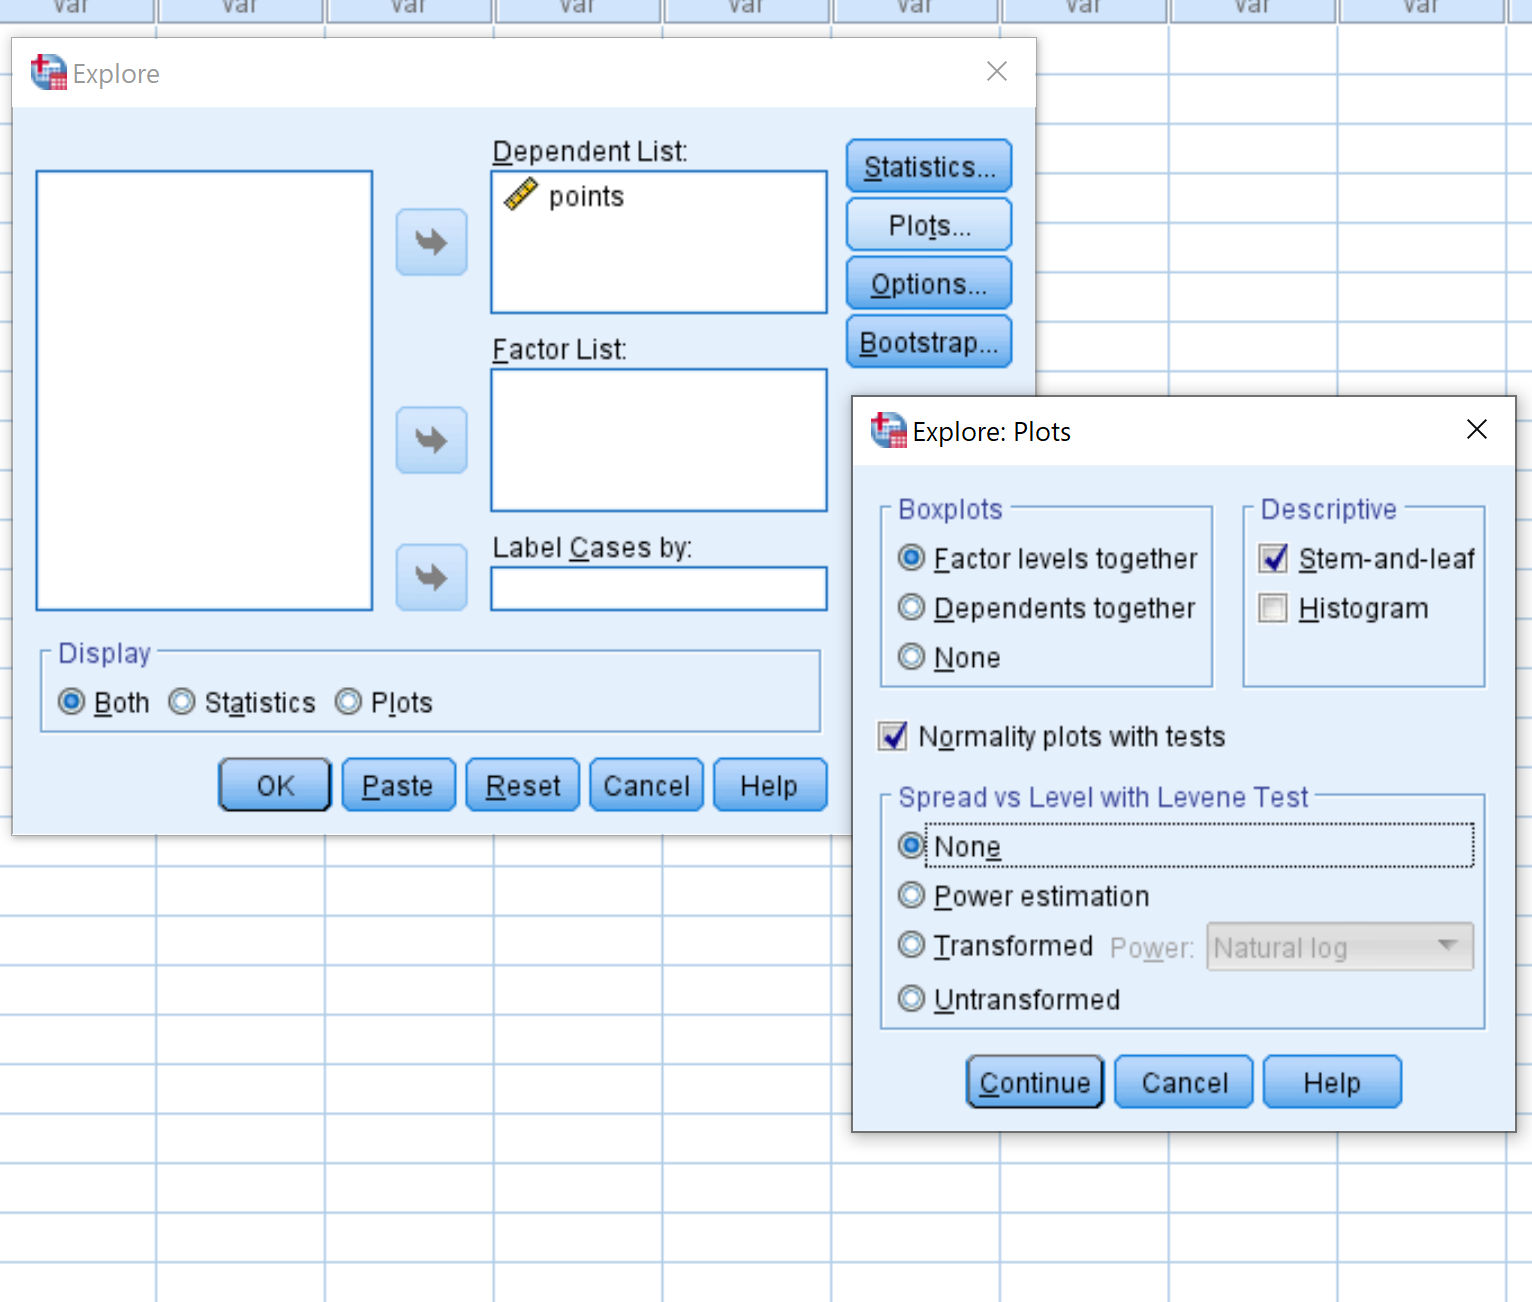
In the new window that pops up, drag the variable points into the box labelled Dependent List. Then click Plots and make sure the box next to Normality plots with tests is selected. Then click Continue. Then click OK.
Once you click OK, the results of the normality tests will be shown in the following box:
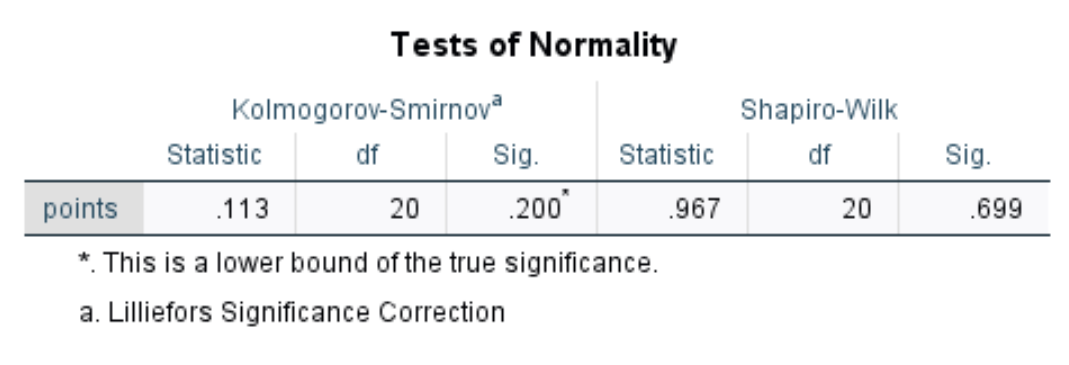
The test statistic and corresponding p-value for each test are shown:
Kolmogorov Smirnov Test:
- Test statistic: .113
- p-value: .200
Shapiro-Wilk Test:
- Test statistic: .967
- p-value: .699
The p-values for both tests are not less than 0.05, which means we do not have sufficient evidence to say the variable points is not normally distributed.
If we wanted to perform some statistical test that assumes variables are normally distributed, we would know that the variable points satisfies this assumption.