You can use the following basic syntax to load multiple packages in R at once:
lapply(some_packages, library, character.only=TRUE)
In this example, some_packages represents a vector of package names you’d like to load.
The following example shows how to use this syntax in practice.
Example: Load Multiple Packages in R
The following code shows how to summarize a dataset in R and create a plot using three different packages:
- dplyr
- ggplot2
- ggthemes
In this example, we load each package individually using three different library() functions:
library(dplyr)
library(ggplot2)
library(ggthemes)

#make this example reproducible
set.seed(0)

#create data frame
df frame(category=rep(c('A', 'B', 'C', 'D', 'E'), each=10),
                 value=runif(50, 10, 20))

#create summary data frame
df_summary %
  group_by(category) %>%
  summarize(mean=mean(value),
            sd=sd(value))

#plot mean value of each category with error bars
ggplot(df_summary) +
    geom_bar(aes(x=category, y=mean), stat='identity') +
    geom_errorbar(aes(x=category, ymin=mean-sd, ymax=mean+sd), width=0.3) +
    theme_tufte()
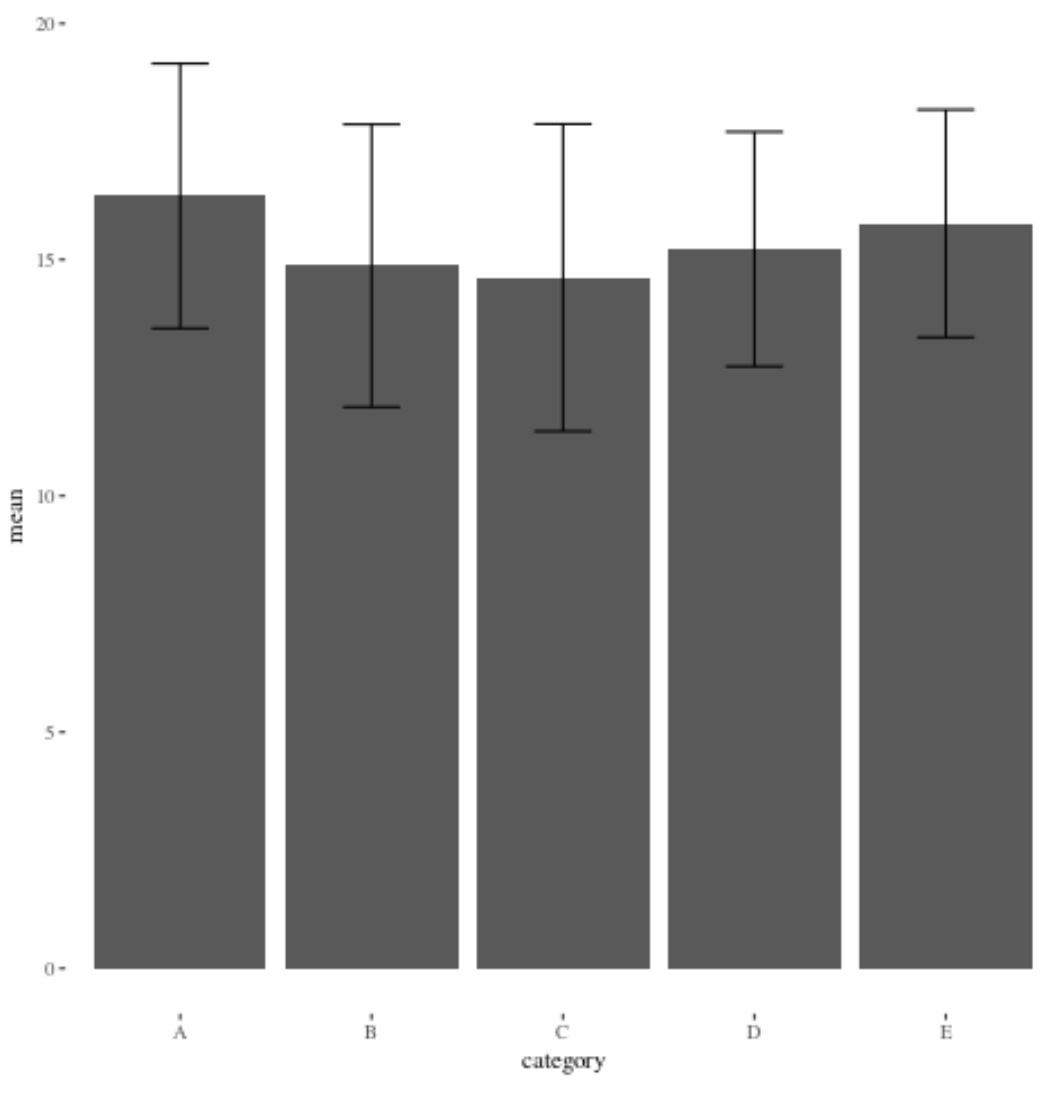
Using this code, we’re able to load all three packages and produce a plot that summarizes the values in a dataset.
However, we could achieve the same outcome using the lapply() function to load all three packages using just one line of code:
#define vector of packages to load
some_packages ggplot2', 'dplyr', 'ggthemes')

#load all packages at once
lapply(some_packages, library, character.only=TRUE)

#make this example reproducible
set.seed(0)

#create data frame
df frame(category=rep(c('A', 'B', 'C', 'D', 'E'), each=10),
                 value=runif(50, 10, 20))

#create summary data frame
df_summary %
  group_by(category) %>%
  summarize(mean=mean(value),
            sd=sd(value))

#plot mean value of each category with error bars
ggplot(df_summary) +
    geom_bar(aes(x=category, y=mean), stat='identity') +
    geom_errorbar(aes(x=category, ymin=mean-sd, ymax=mean+sd), width=0.3) +
    theme_tufte()
Once again, we’re able to load all three packages and produce the same plot as before.
The difference is that we’re able to load all three packages using just one line of code this time.
This lapply() function is particularly useful when you want to load a long list of packages without typing out the library() function each time.
Additional Resources
The following tutorials explain how to perform other common tasks in R:
How to Clear the Environment in R
How to Clear All Plots in RStudio
How to Interpret in R: The following objects are masked