Autocorrelation measures the degree of similarity between a time series and a lagged version of itself over successive time intervals.
It’s also sometimes referred to as “serial correlation” or “lagged correlation” since it measures the relationship between a variable’s current values and its historical values.
When the autocorrelation in a time series is high, it becomes easy to predict future values by simply referring to past values.
How to Calculate Autocorrelation in R
Suppose we have the following time series in R that shows the value of a certain variable during 15 different time periods:
#define data
x
We can calculate the autocorrelation for every lag in the time series by using the acf() function from the tseries library:
library(tseries)

#calculate autocorrelations
acf(x, pl=FALSE)

     0      1      2      3      4      5      6      7      8      9     10
 1.000  0.832  0.656  0.491  0.279  0.031 -0.165 -0.304 -0.401 -0.458 -0.450
    11
-0.369
The way to interpret the output is as follows:
- The autocorrelation at lag 0 is 1.
- The autocorrelation at lag 1 is 0.832.
- The autocorrelation at lag 2 is 0.656.
- The autocorrelation at lag 3 is 0.491.
And so on.
We can also specify the number of lags to display with the lag argument:
#calculate autocorrelations up to lag=5
acf(x, lag=5, pl=FALSE)

Autocorrelations of series 'x', by lag

    0     1     2     3     4     5
1.000 0.832 0.656 0.491 0.279 0.031
How to Plot the Autocorrelation Function in R
We can plot the autocorrelation function for a time series in R by simply not using the pl=FALSE argument:
#plot autocorrelation function
acf(x)
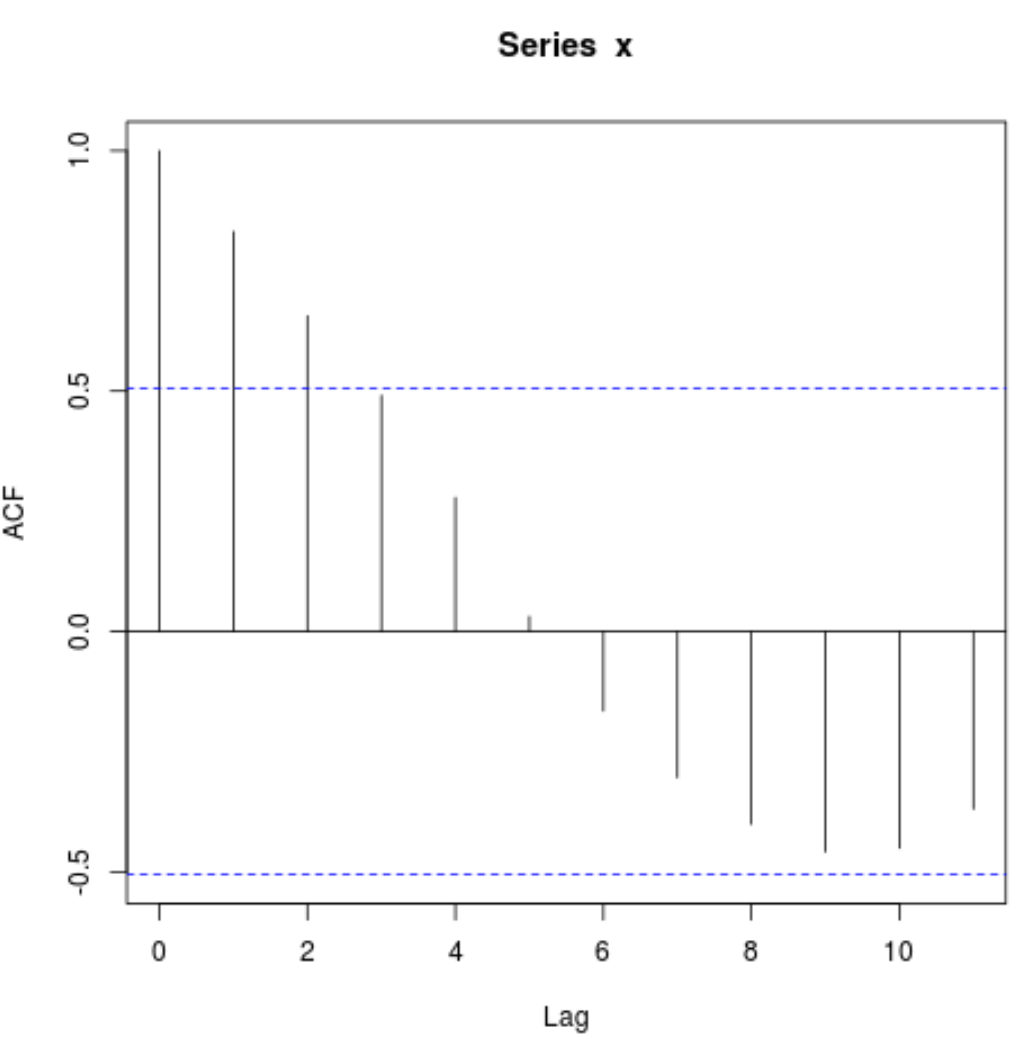
The x-axis displays the number of lags and the y-axis displays the autocorrelation at that number of lags. By default, the plot starts at lag = 0 and the autocorrelation will always be 1 at lag = 0.
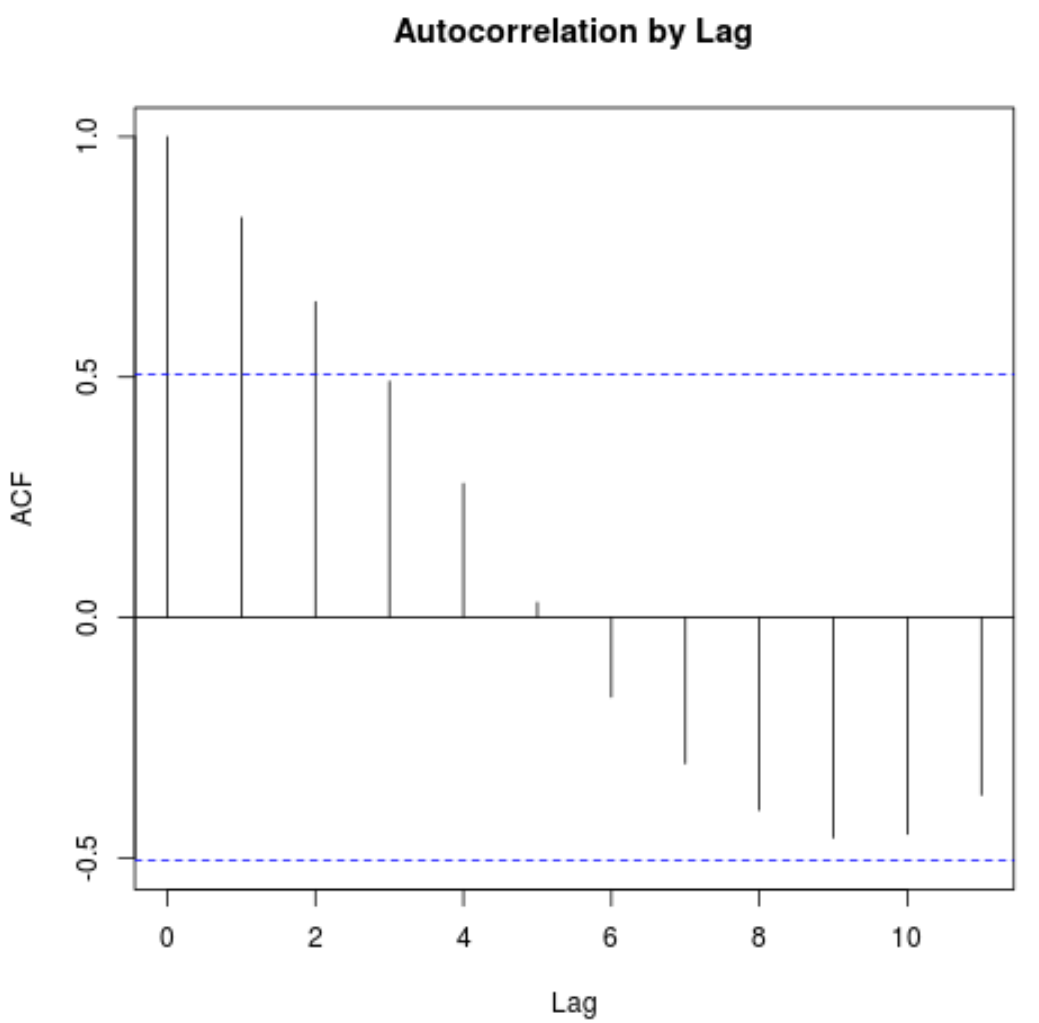
You can also specify a different title for the plot by using the main argument:
#plot autocorrelation function with custom title
acf(x, main='Autocorrelation by Lag')
Additional Resources
How to Calculate Autocorrelation in Python
How to Calculate Autocorrelation in Excel