An ANOVA (“analysis of variance”) is a type of model that is used to determine whether or not there is a significant difference between the means of three or more independent groups.
Whenever we fit an ANOVA model to a dataset, there will always be residuals – these represent the difference between each individual observation and the mean of the group that the observation came from.
The following example shows how to calculate residuals for an ANOVA model in practice.
Example: Calculating Residuals in ANOVA
Suppose we recruit 90 people to participate in a weight-loss experiment in which we randomly assign 30 people to follow either program A, program B, or program C for one month.
We can conduct a one-way ANOVA to determine if there is a statistically significant difference between the resulting weight loss from the three programs.
Suppose we calculate the mean weight loss for individuals in each program to be:
- Program A: 1.58 pounds
- Program B: 2.56 pounds
- Program C: 4.13 pounds
The residuals for the ANOVA model would be the difference between each individual’s weight loss and the mean weight loss in their program.
For example, the following table shows how to calculate the residuals for 10 different individuals in the study:

Notice the following pattern:
- Individuals who had a value greater than their group mean had a positive residual.
- Individuals who had a value less than their group mean had a negative residual.
In practice, we would calculate the residuals for all 90 individuals.
How to Use Residuals to Check Normality
One of the assumptions of an ANOVA is that the residuals are normally distributed.
The most common way to check this assumption is by creating a Q-Q plot.
If the residuals are normally distributed, then the points in a Q-Q plot will lie on a straight diagonal line.
Here’s what a Q-Q plot would look like for our previous example:
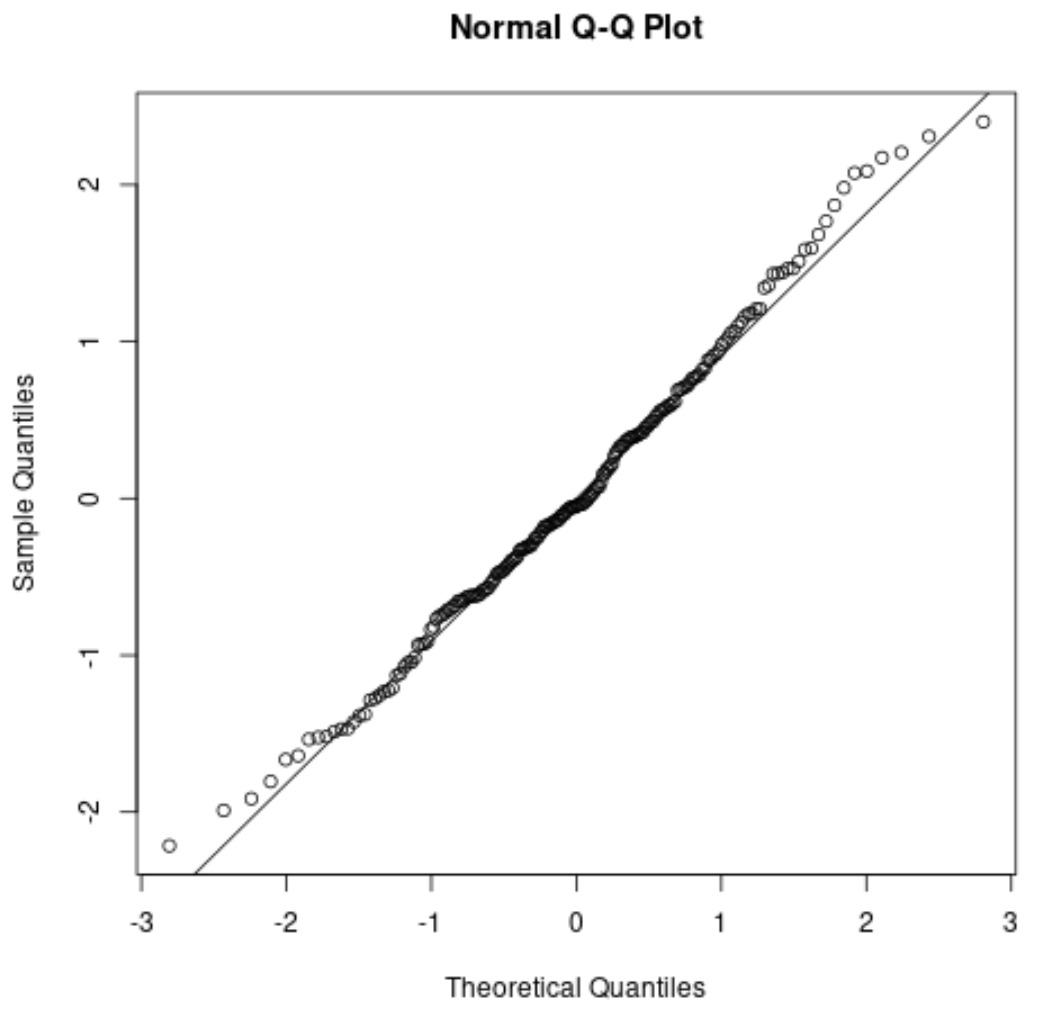
The points deviate a bit from the straight diagonal line on the tail ends, but in general the points fall follow the diagonal line quite well. This tells us that the assumption of normality is likely met.
As reference, here’s what a Q-Q plot for non-normally distributed residuals might look like:

The points deviate wildly from the straight diagonal line, which indicates that the residuals are not normally distributed.
Refer to the following tutorials to learn how to create Q-Q plots in different software:
Additional Resources
The following articles provide additional information about ANOVA models:
An Introduction to the One-Way ANOVA
How to Check ANOVA Assumptions
4 Examples of Using ANOVA in Real Life