Many statistical tests (like a one-way ANOVA or two-way ANOVA) make the assumption that the variance among several groups is equal.
One way to formally test this assumption is to use Levene’s Test, which tests whether or not the variance among two or more groups is equal.
This test has the following hypotheses:
Null hypothesis (H0): The variance among the groups is equal.
Alternative hypothesis (HA): The variance among the groups is not equal.
If the p-value from the test is less than our chosen significance level, we can reject the null hypothesis and conclude that we have enough evidence to state that the variance among the groups is not equal.
How to Conduct Levene’s Test in R
To conduct Levene’s test in R, we can use the leveneTest() function from the car library, which uses the following syntax:
leveneTest(response variable ~ group variable, data = data)
As an example, consider the following data frame that shows how much weight people lost on three different weight loss programs:
#make this example reproducible
set.seed(0)

#create data frame
data frame(program = rep(c("A", "B", "C"), each = 30),
                   weight_loss = c(runif(30, 0, 3),
                                   runif(30, 0, 5),
                                   runif(30, 1, 7)))

#view first six rows of data frame
head(data)

#  program weight_loss
#1       A   2.6900916
#2       A   0.7965260
#3       A   1.1163717
#4       A   1.7185601
#5       A   2.7246234
#6       A   0.6050458
To check if the variance in weight loss is equal among these three programs, we can use the leveneTest() function and use 0.05 as our significance level:
#load car package
library(car)

#conduct Levene's Test for equality of variances
leveneTest(weight_loss ~ program, data = data)

#Levene's Test for Homogeneity of Variance (center = median)
#      Df F value  Pr(>F)
#group  2  4.1716 0.01862 *
#      87
#---
#Signif. codes:  0 '***' 0.001 '**' 0.01 '*' 0.05 '.' 0.1 ' ' 1
The p-value of the test is 0.01862, which is less than our significance level of 0.05.
Thus, we reject the null hypothesis and conclude that the variance among the three groups is not equal.
Visualizing the Differences in Variances
From conducting Levene’s test, we know that the variances among the three groups are not equal.
In addition to conducting this test, we can create boxplots that display the distribution of weight loss for each of the three groups so that we can gain a visual understanding of why Levene’s test rejected the null hypothesis of equal variances.
boxplot(weight_loss ~ program,
  data = data,
  main = "Weight Loss Distribution by Program",
  xlab = "Program",
  ylab = "Weight Loss",
  col = "steelblue",
  border = "black")
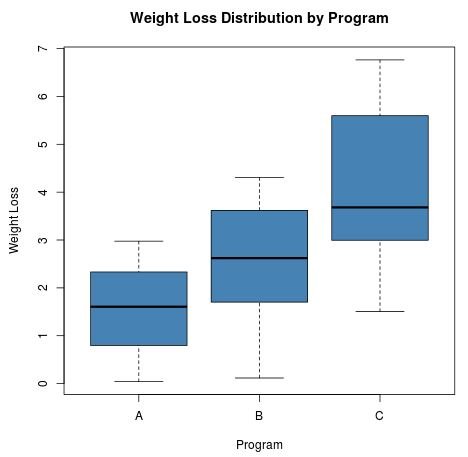
We can see that the variance for weight loss is noticeably higher for participants in Program C compared to the other two programs.
Thus, it makes sense that Levene’s test rejected the null hypothesis that the variances are equal among the three groups.
Additional Resources
The following tutorials explain how to perform Levene’s Test in different statistical software:
How to Perform Levene’s Test in Excel
How to Perform Levene’s Test in Python
How to Perform Levene’s Test in SPSS
How to Perform Levene’s Test in Stata