Side-by-side boxplots can be used to quickly visualize the similarities and differences between different distributions.
This tutorial explains how to create side-by-side boxplots in both base R and ggplot2 using the following data frame:
#create data frame
df frame(team=rep(c('A', 'B', 'C'), each=8),
                 points=c(5, 5, 6, 6, 8, 9, 13, 15,
                          11, 11, 12, 14, 15, 19, 22, 24,
                          19, 23, 23, 23, 24, 26, 29, 33))

#view first 10 rows
head(df, 10)

   team points
1     A      5
2     A      5
3     A      6
4     A      6
5     A      8
6     A      9
7     A     13
8     A     15
9     B     11
10    B     11
Side-by-Side Boxplots in Base R
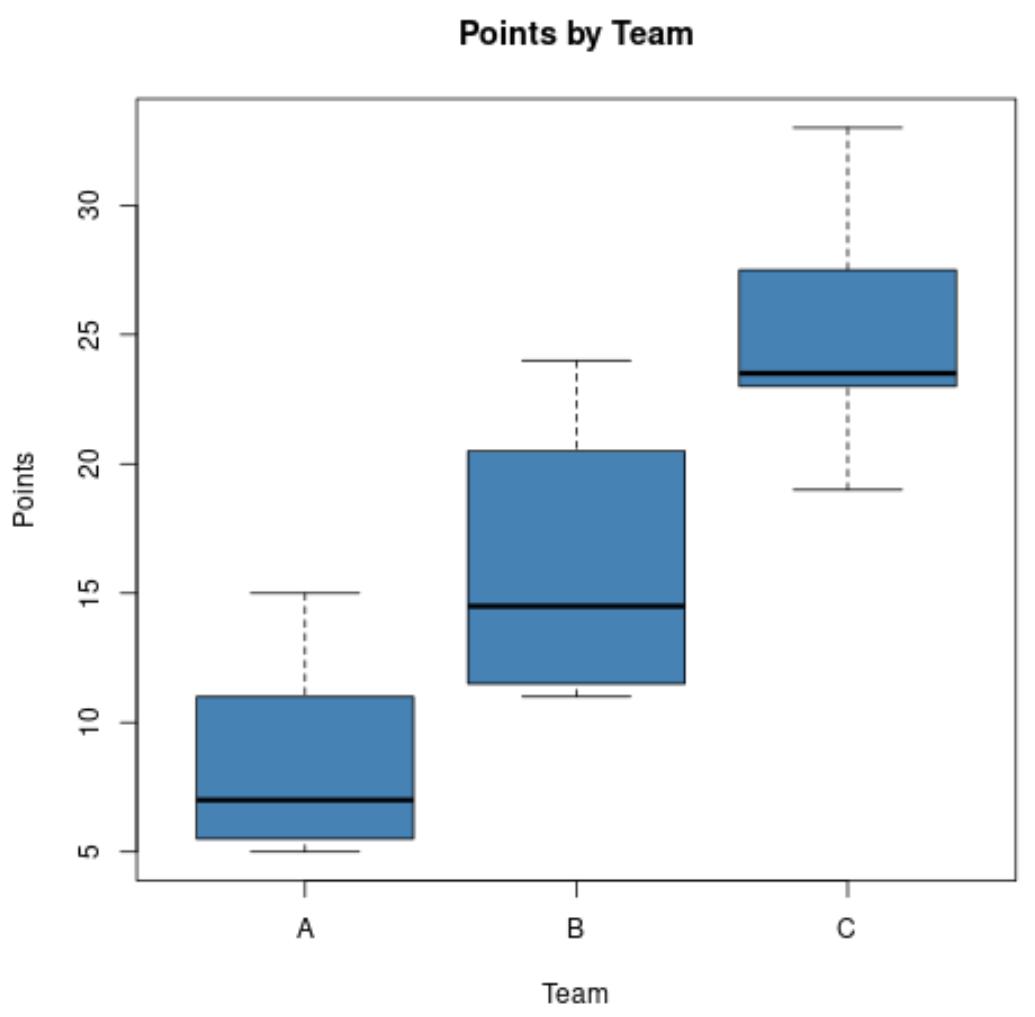
The following code shows how to create side-by-side boxplots in base R:
#create vertical side-by-side boxplots
boxplot(df$points ~ df$team,
        col='steelblue',
        main='Points by Team',
        xlab='Team',
        ylab='Points')
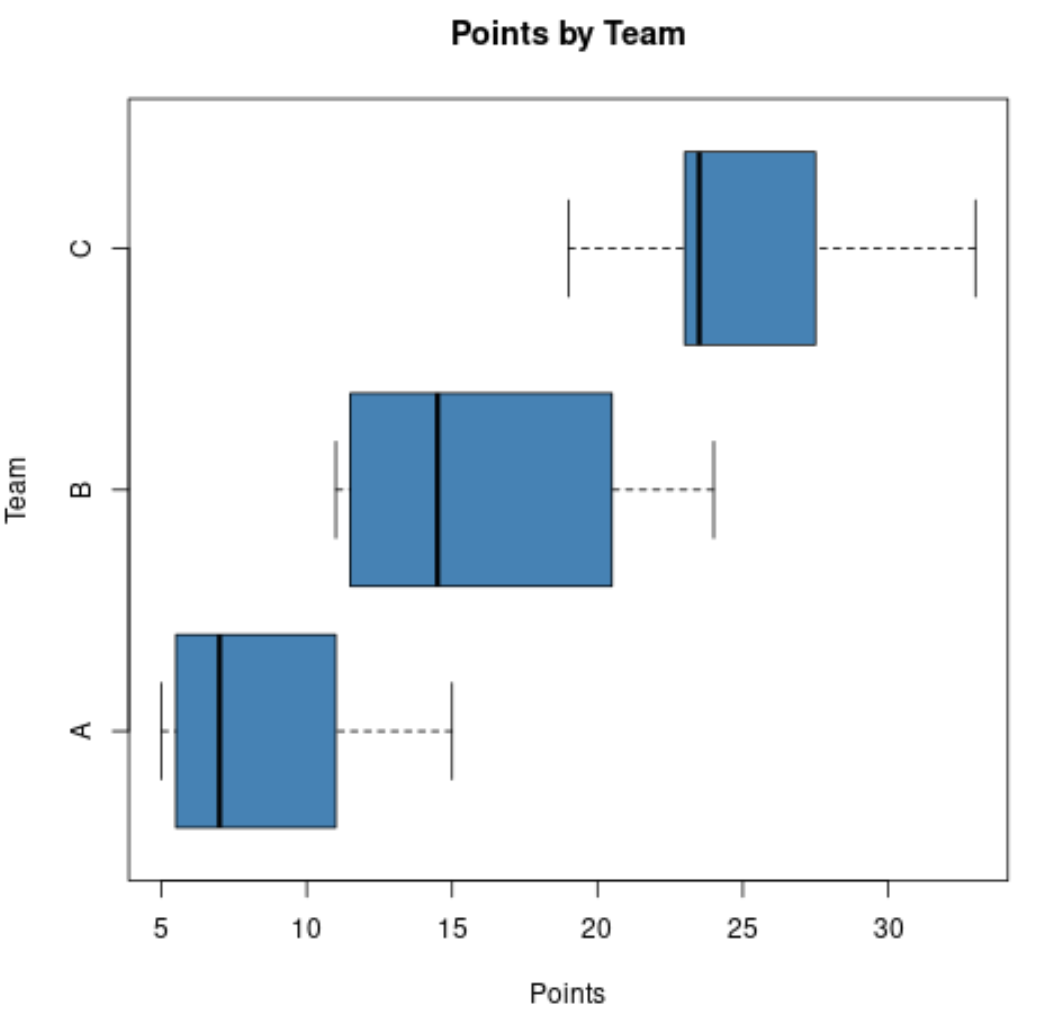
We can use the argument horizontal=TRUE to display the boxplots horizontally instead of vertically:
#create horizontal side-by-side boxplots
boxplot(df$points ~ df$team,
        col='steelblue',
        main='Points by Team',
        xlab='Points',
        ylab='Team',
        horizontal=TRUE)
Side-by-Side Boxplots in ggplot2
The following code shows how to create vertical side-by-side boxplots in ggplot2:
library(ggplot2)

#create vertical side-by-side boxplots
ggplot(df, aes(x=team, y=points, fill=team)) +
  geom_boxplot() +
  ggtitle('Points by Team')

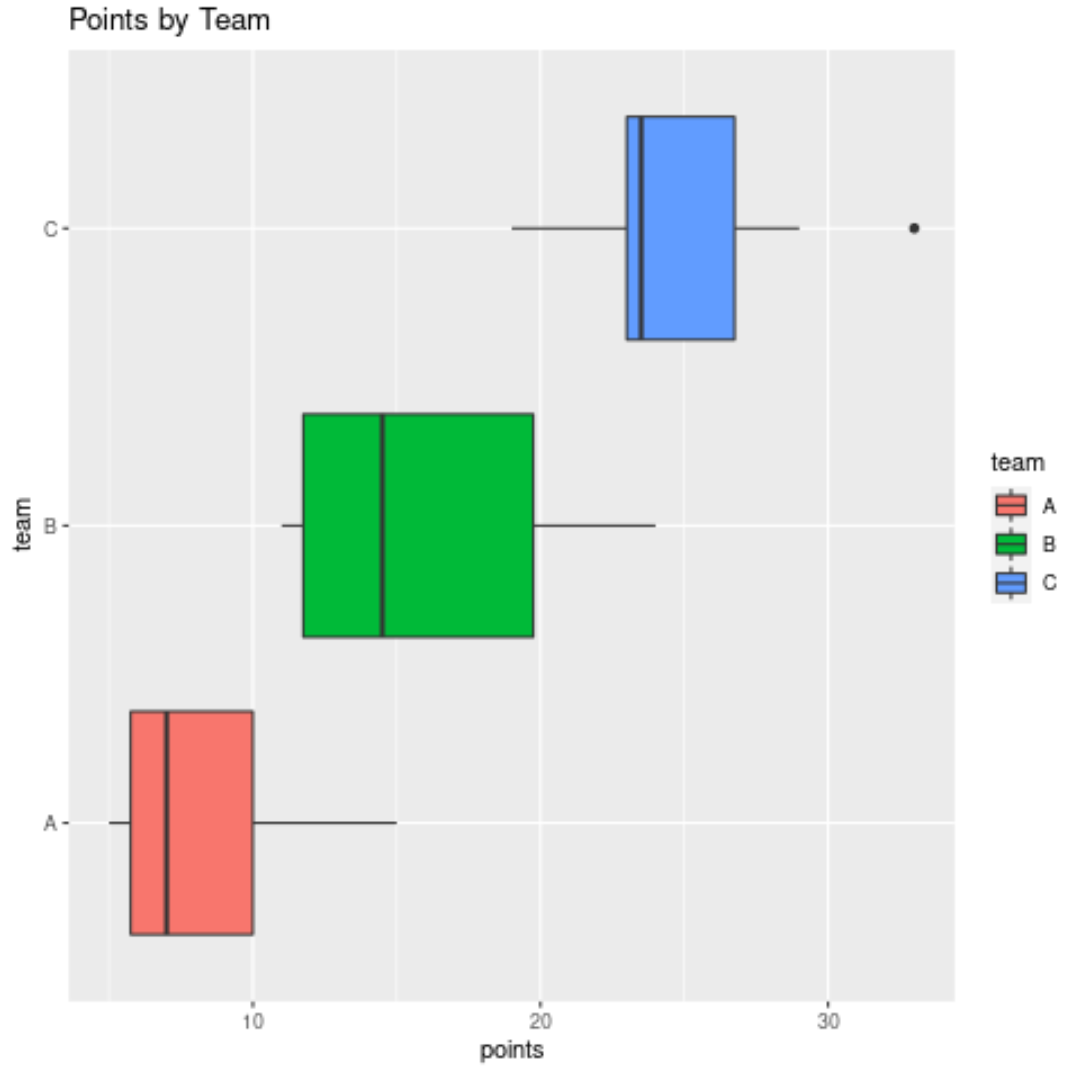
And we can use the coord_flip() argument to display the boxplots horizontally instead of vertically:
library(ggplot2)

#create horizontal side-by-side boxplots
ggplot(df, aes(x=team, y=points, fill=team)) +
  geom_boxplot() +
  coord_flip() +
  ggtitle('Points by Team')
Additional Resources
How to Create a Strip Chart in R
How to Plot Multiple Lines in R
How to Create a Population Pyramid in R