You can use the following basic syntax to specify the positions and labels of axis ticks on seaborn plots:
#specify x-axis tick positions and labels
plt.xticks([1, 2, 3], ['A', 'B', 'C'])

#specify y-axis tick positions and labels
plt.yticks([4, 5, 6], ['D', 'E', 'F'])
The following examples show how to use this syntax in practice.
Example 1: Set Axis Tick Positions
The following code shows how to create a simple scatterplot using seaborn:
import pandas as pd
import matplotlib.pyplot as plt
import seaborn as sns

#create DataFrame
df = pd.DataFrame({'var1': [25, 12, 15, 14, 19, 23, 25, 29],
                   'var2': [5, 7, 7, 9, 12, 9, 9, 4]})

#create scatterplot
sns.scatterplot(data=df, x='var1', y='var2')
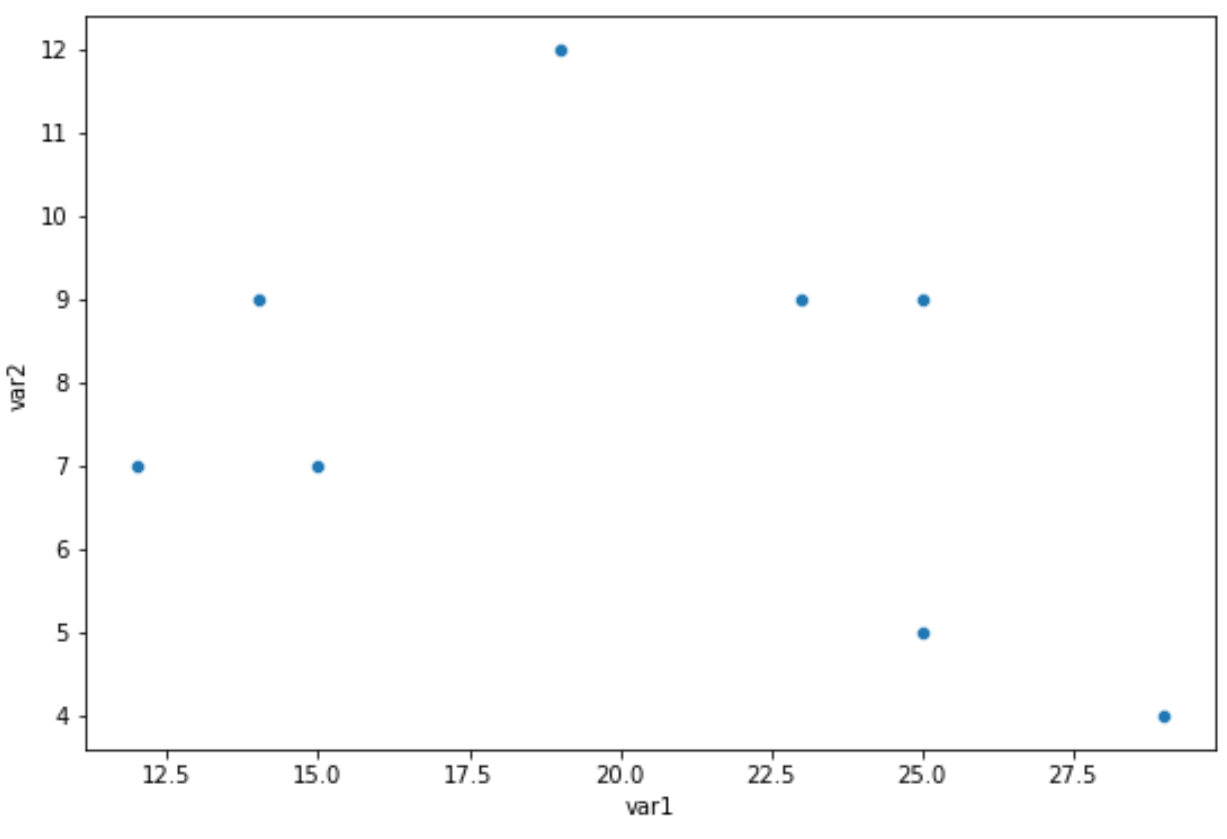
By default, seaborn chooses an optimal number of ticks to display on both the x-axis and y-axis.
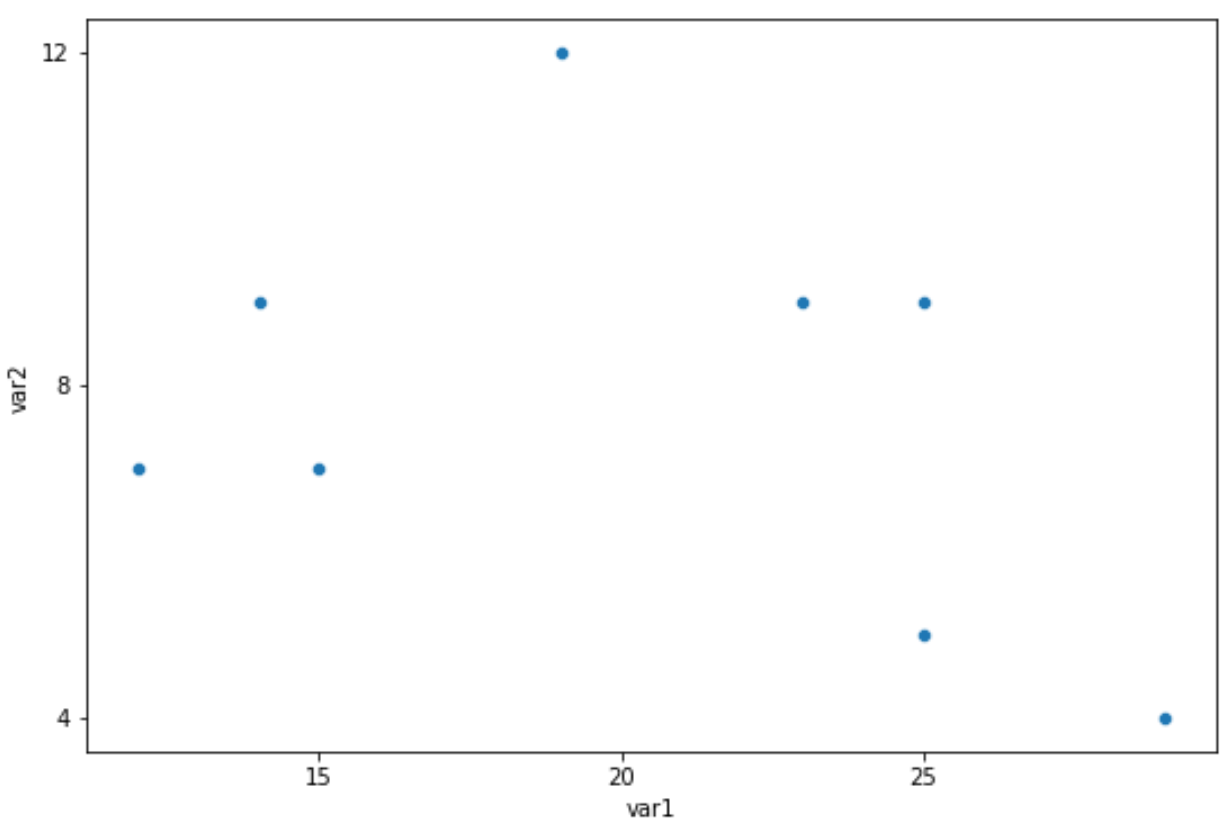
However, we can use the following code to specify the number of ticks and their exact positions on each axis:
import pandas as pd
import matplotlib.pyplot as plt
import seaborn as sns

#create DataFrame
df = pd.DataFrame({'var1': [25, 12, 15, 14, 19, 23, 25, 29],
                   'var2': [5, 7, 7, 9, 12, 9, 9, 4]})

#create scatterplot
sns.scatterplot(data=df, x='var1', y='var2')

#specify positions of ticks on x-axis and y-axis
plt.xticks([15, 20, 25])
plt.yticks([4, 8, 12])
Example 2: Set Axis Tick Positions & Labels
The following code shows how to create a scatterplot and specify both the axis tick positions and the tick labels:
import pandas as pd
import matplotlib.pyplot as plt
import seaborn as sns

#create DataFrame
df = pd.DataFrame({'var1': [25, 12, 15, 14, 19, 23, 25, 29],
                   'var2': [5, 7, 7, 9, 12, 9, 9, 4]})

#create scatterplot
sns.scatterplot(data=df, x='var1', y='var2')

#specify positions of ticks on x-axis and y-axis
plt.xticks([15, 20, 25], ['A', 'B', 'C'])
plt.yticks([4, 8, 12], ['Low', 'Medium', 'High'])

Note: Refer to this article to see how to change just the axis labels.
Additional Resources
The following tutorials explain how to perform other common functions in seaborn:
How to Adjust the Figure Size of a Seaborn Plot
How to Add a Title to Seaborn Plots
How to Save Seaborn Plot to a File