A paired samples t-test is used to compare the means of two samples when each observation in one sample can be paired with an observation in the other sample.
This type of test makes the following assumptions about the data:
1. Independence: Each observation should be independent of every other observation.
2. Normality: The differences between the pairs should be approximately normally distributed.
3. No Extreme Outliers: There should be no extreme outliers in the differences.
If one or more of these assumptions are violated, then the results of the paired samples t-test may be unreliable or misleading.
In this tutorial we provide an explanation of each assumption, how to determine if the assumption is met, and what to do if the assumption is violated.
Assumption 1: Independence
A paired samples t-test makes the assumption that each observation is independent of every other observation.
How to Check this Assumption
The easiest way to check this assumption is to verify that each observation was collected using a random sampling method.
If a random sampling method was used (such as simple random sampling) then we can assume that each observation is independent of every other observation.
What to Do if this Assumption is Violated
If this assumption is violated, the results of the paired samples t-test are completely invalid.
In this scenario, it’s best to collect new observations using a random sampling method to ensure that each observation is independent.
Assumption 2: Normality
A paired samples t-test assumes that the differences between the pairs should be approximately normally distributed.
This is a crucial assumption because if the differences between the pairs are not normally distributed then it isn’t valid to use the p-value from the test to draw conclusions.
How to Check this Assumption
The easiest way to check this assumption is to simply make a histogram of the paired differences and visually check whether or not the histogram exhibits a bell shape.
For example, if the histogram looks like this then we would say that the normality assumption is met:

However, if the histogram looks something like this then we would say the normality assumption is not met:

What to Do if this Assumption is Violated
If this assumption is violated then we can perform a Wilcoxon Signed Rank Test, which is considered the non-parametric equivalent to the paired samples t-test and does not make the assumption that the paired differences are normally distributed.
Assumption 3: No Extreme Outliers
A paired samples t-test makes the assumption that there are no extreme outliers in the data.
How to Check this Assumption
The easiest way to check this assumption is to create a boxplot of the paired differences and visually check if there are any outliers.
For example, suppose the boxplot of paired differences looks like this:

Most of the paired differences are around zero, but there is one paired difference equal to about 19, which is a clear outlier.
Note: A circle is typically used in a boxplot to indicate an outlier value.
However, suppose the boxplot of paired differences looked like this instead:
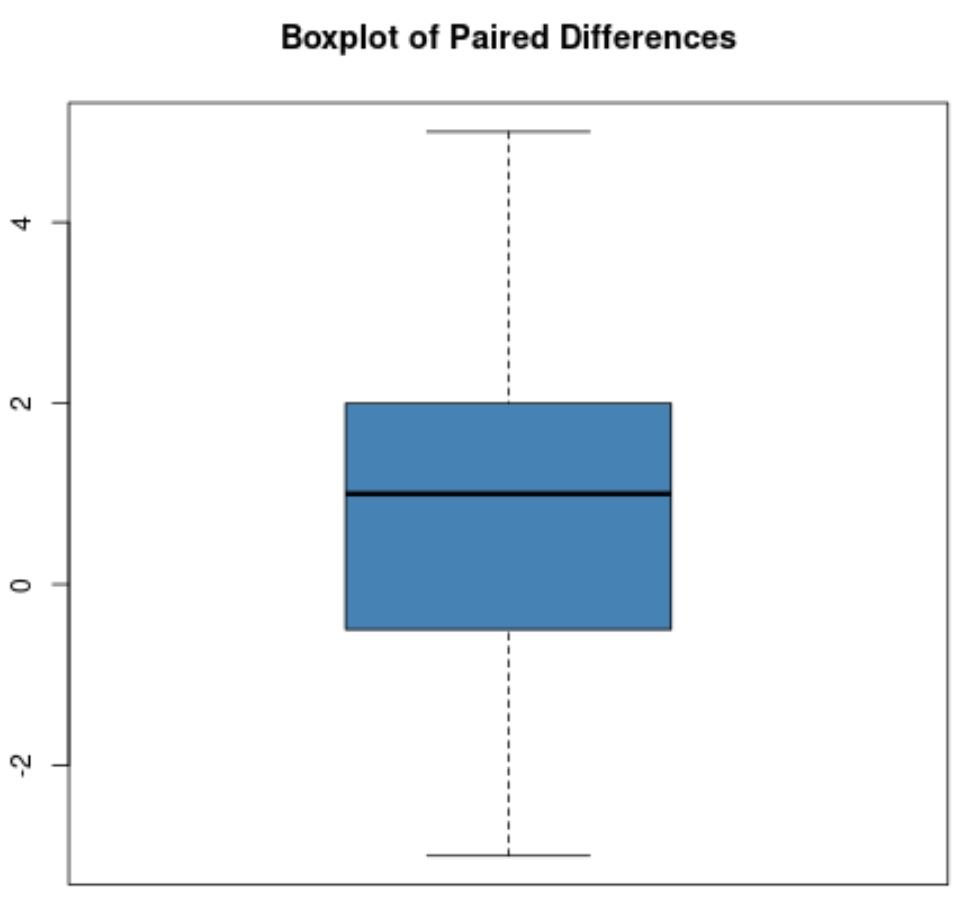
There are no clear outliers in this boxplot so we would assume that there are no extreme outliers in the data.
What to Do if this Assumption is Violated
If this assumption is violated, then the results of the paired samples t-test could be unusually effected by the outlier.
In this scenario, you can remove the outlier if you suspect that it represents a faulty data point or is the result of a data entry error.
Alternatively, you can keep the outlier and simply make a note of it when reporting the results of the paired samples t-test.
Additional Resources
The following tutorials explain the assumptions made in other statistical tests:
The Four Assumptions Made in a t-Test
The Four Assumptions of a Chi-Square Test
The Four Assumptions of Parametric Tests