A Kruskal-Wallis Test is used to determine whether or not there is a statistically significant difference between the medians of three or more independent groups.
It is considered to be the non-parametric equivalent of the One-Way ANOVA.
This tutorial provides a step-by-step example of how to conduct a Kruskal-Wallis Test in SAS.
Step 1: Enter the Data
Suppose researchers want to know if three different fertilizers lead to different levels of plant growth.
They randomly select 30 different plants and split them into three groups of 10, applying a different fertilizer to each group. At the end of one month they measure the height of each plant.
We’ll enter the following data in SAS, which shows the total growth (in inches) for each of the 10 plants in each group:
/*create dataset*/
data fertilizer_data;
    input fertilizer $ growth;
    datalines;
fert1 7
fert1 14
fert1 14
fert1 13
fert1 12
fert1 9
fert1 6
fert1 14
fert1 12
fert1 8
fert2 15
fert2 17
fert2 13
fert2 15
fert2 15
fert2 13
fert2 9
fert2 12
fert2 10
fert2 8
fert3 6
fert3 8
fert3 8
fert3 9
fert3 5
fert3 14
fert3 13
fert3 8
fert3 10
fert3 9
;
run;
Step 2: Perform the Kruskal-Wallis Test
Next, we will use the proc npar1way statement to perform a Kruskal-Wallis test to compare the median growth of the plants between the three fertilizer groups:
/*perform Kruskal-Wallis test*/
proc npar1way data=fertilizer_data wilcoxon dscf;
    class fertilizer;
    var growth;
run;
Step 3: Interpret the Results
The first table in the output shows the overall Chi-Squared test statistic and the corresponding p-value for the Kruskal-Wallis test:

The p-value of the test is 0.0431. Since this value is less than .05, we reject the null hypothesis that the median plant growth is the same for all three fertilizers.
This means we have sufficient evidence to conclude that the type of fertilizer used leads to statistically significant differences in plant growth.
The last table in the output shows the p-values for the pairwise comparisons between each of the three groups:
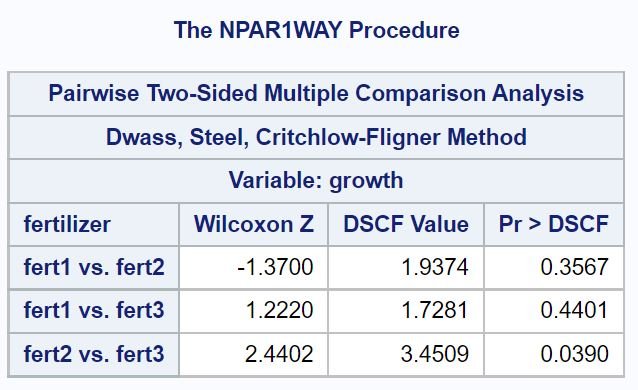
From this table we can see that the only p-value less than .05 is the comparison between fertilizer 2 and fertilizer 3, which has a p-value of 0.0390.
This means there is a statistically significant difference in plant growth between fertilizer 2 and fertilizer 3, but not between any other pairwise comparisons.
Additional Resources
The following tutorials explain how to perform other common statistical tests in SAS:
How to Perform a One Sample t-Test in SAS
How to Perform a Two Sample t-Test in SAS
How to Perform a One-Way ANOVA in SAS
How to Perform a Two-Way ANOVA in SAS