The Friedman Test is a non-parametric alternative to the Repeated Measures ANOVA. It is used to determine whether or not there is a statistically significant difference between the means of three or more groups in which the same subjects show up in each group.
This tutorial explains how to perform the Friedman Test in Excel.
Example: The Friedman Test in Excel
Use the following steps to perform the Friedman Test in Excel.
Step 1: Enter the data.
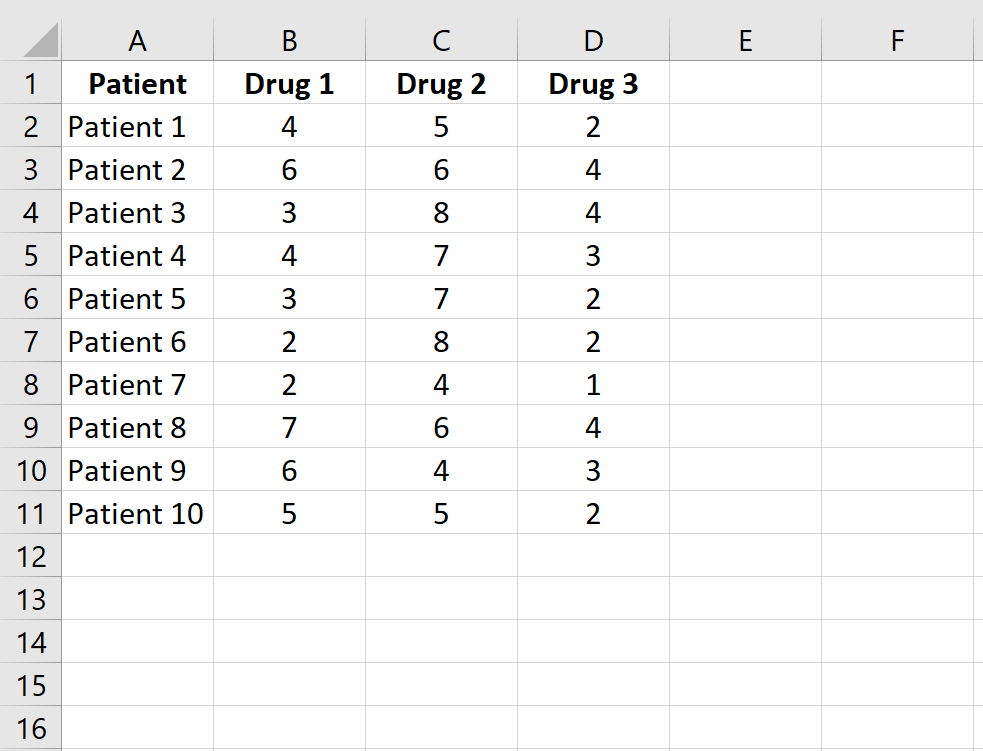
Enter the following data, which shows the reaction time (in seconds) of 10 patients on three different drugs. Since each patient is measured on each of the three drugs, we will use the Friedman Test to determine if the mean reaction time differs between drugs.
Step 2: Rank the data.
Next, rank the data values in each row in ascending order using the =RANK.AVG() function. The following formula shows how to calculate the rank for the response time of patient 1 on drug 1:
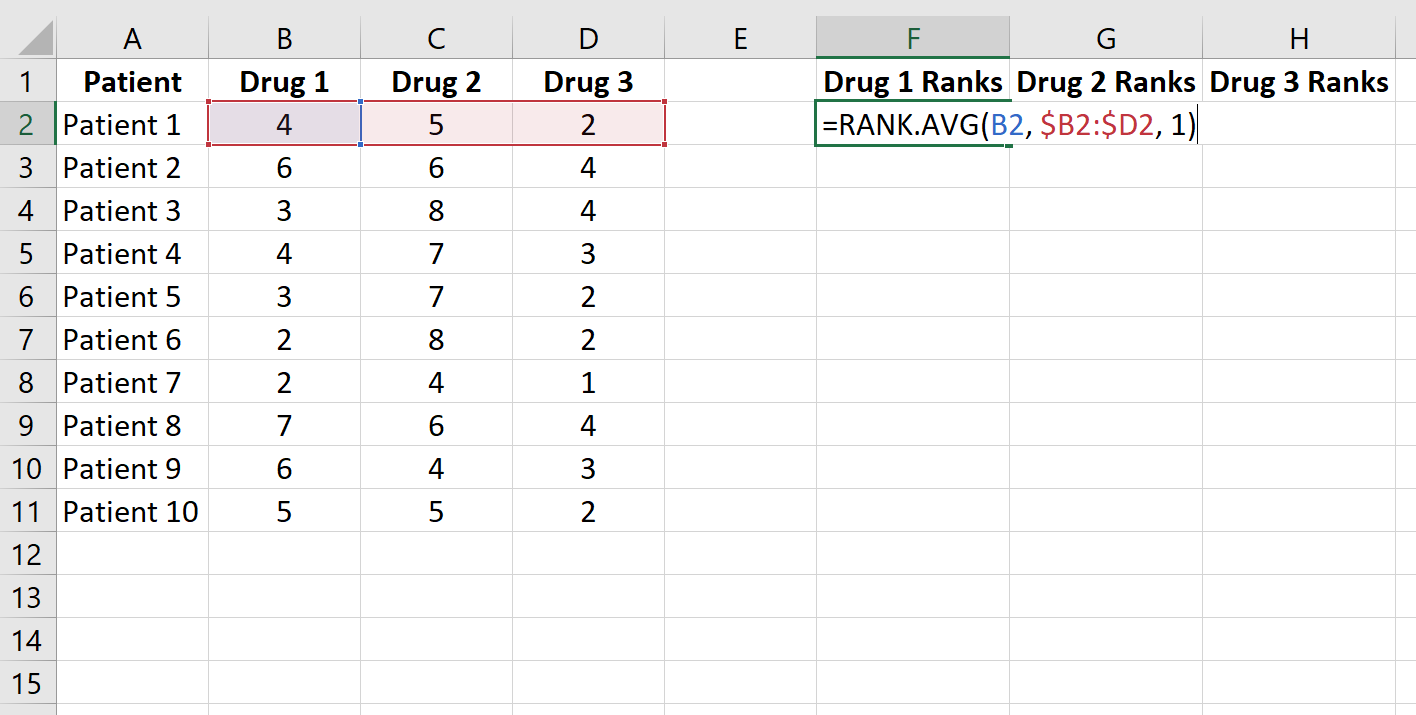
Copy this formula to the rest of the cells:

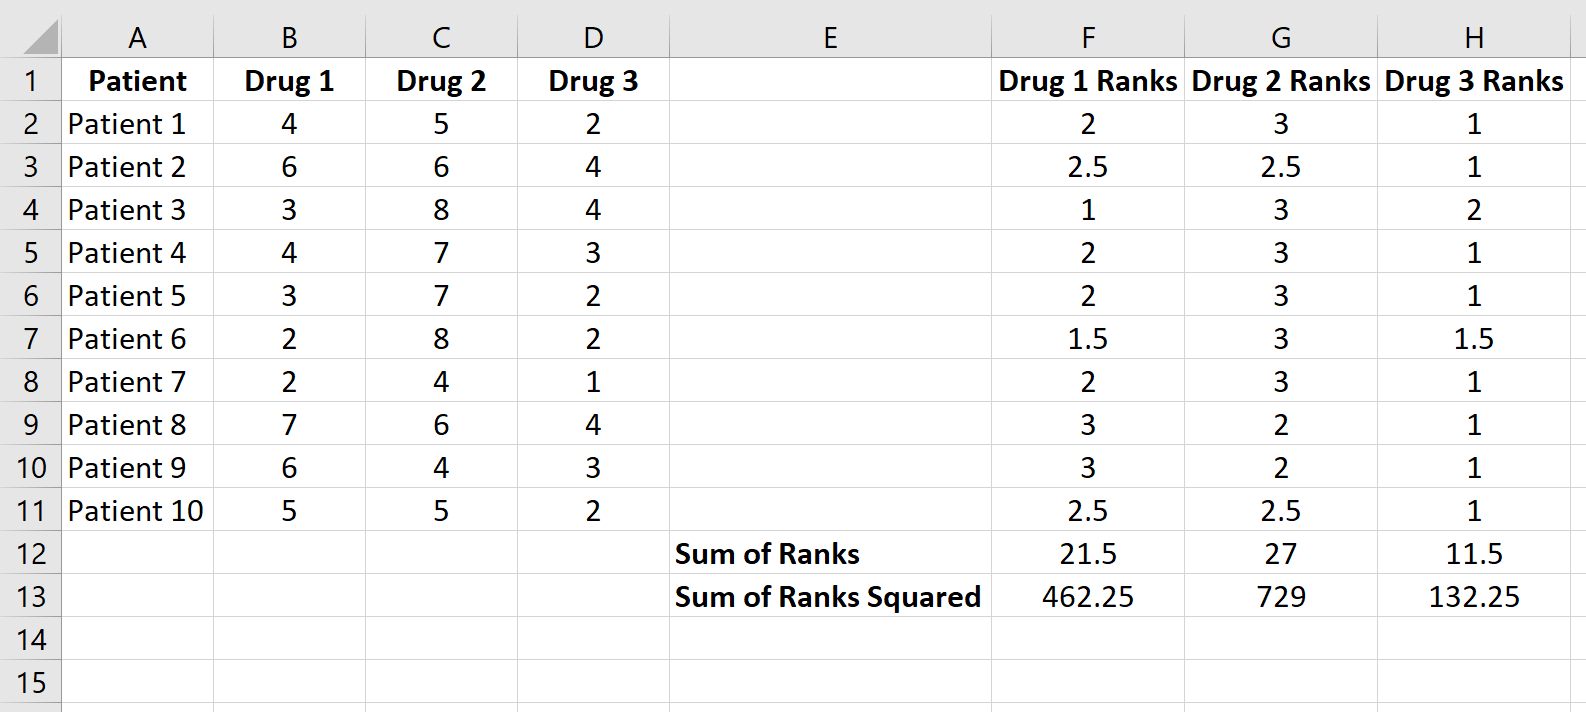
Then, calculate the sum of the ranks for each column along with the squared sum of ranks:
Step 3: Calculate the test statistic and the corresponding p-value.
The test statistic is defined as:
Q = 12/nk(k+1) * ΣRj2 – 3n(k+1)
where:
- n = number of patients
- k = number of treatment groups
- Rj2 =sum of ranks for the jth group
Under the null hypothesis, Q follows a chi-square distribution with k-1 degrees of freedom.
The following screenshot shows the formulas used to calculate the test statistic, Q, and the corresponding p-value:
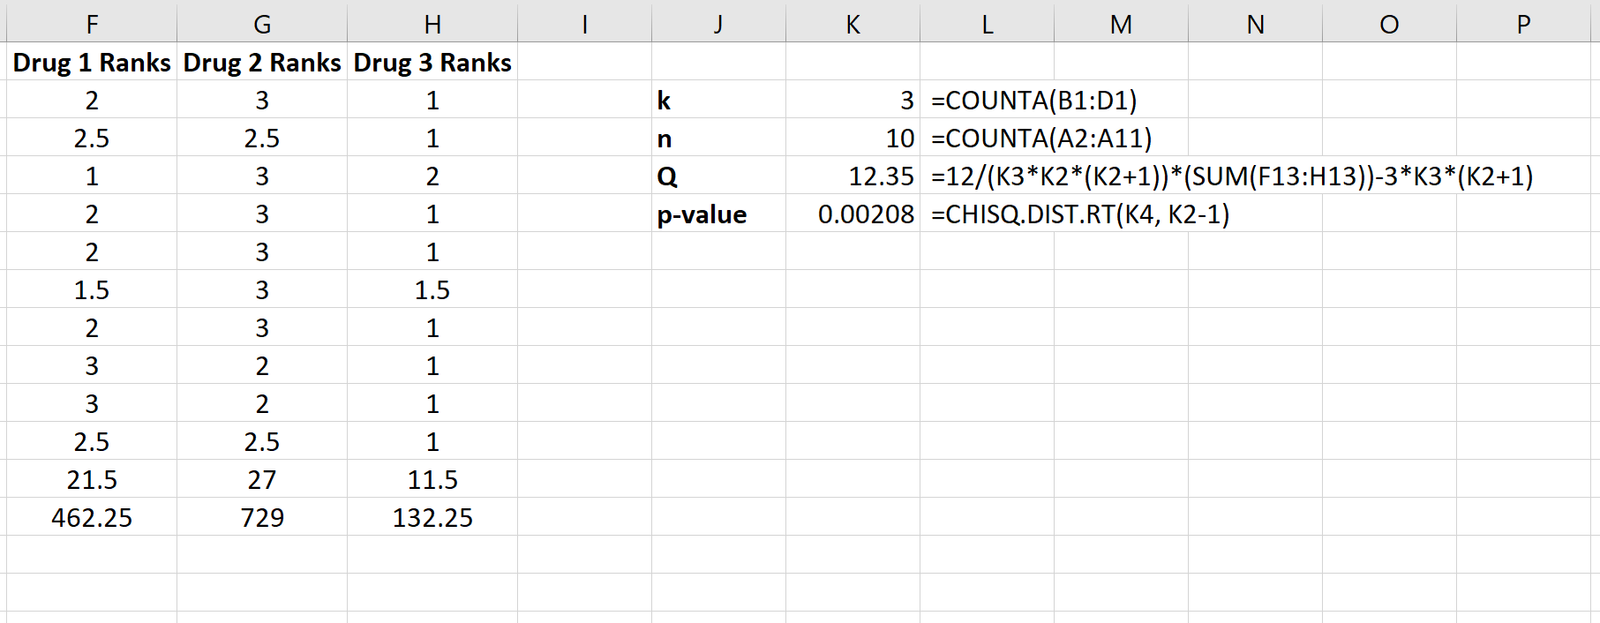
The test statistic is Q = 12.35 and the corresponding p-value is p = 0.00208. Since this value is less than 0.05, we can reject the null hypothesis that the mean response time is the same for all three drugs. We have sufficient evidence to conclude that the type of drug used leads to statistically significant differences in response time.
Step 4: Report the results.
Lastly, we want to report the results of the test. Here is an example of how to do so:
A Friedman Test was conducted on 10 patients to examine the effect that three different drugs had on response time. Each patient used each drug once.
Results showed that the type of drug used lead to statistically significant differences in response time (Q = 12.35, p = 0.00208).