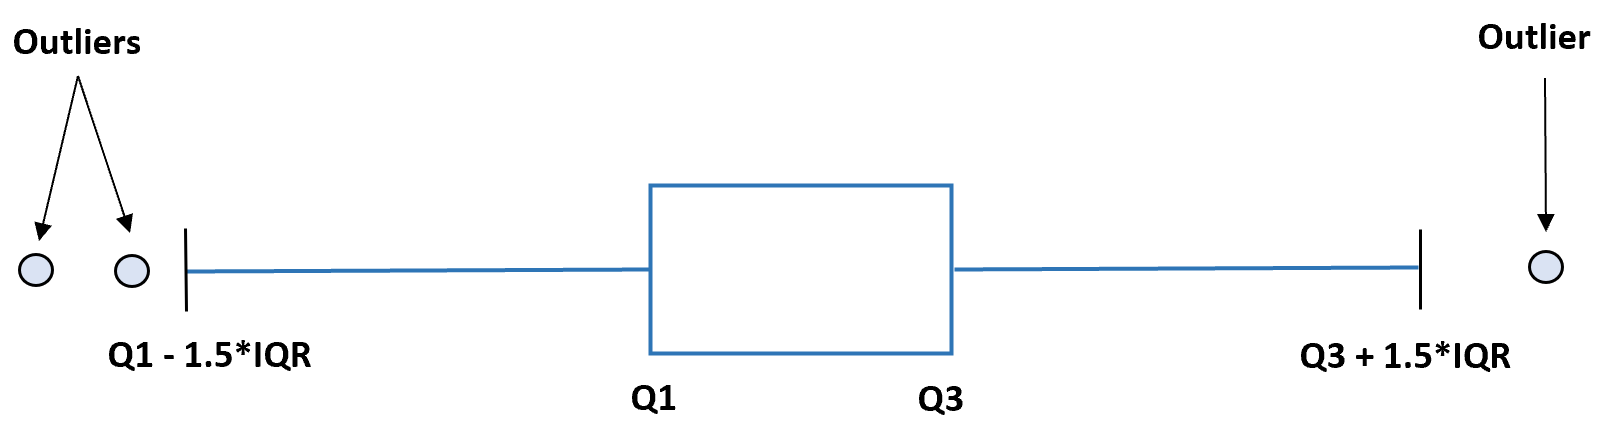
An outlier is an observation that lies abnormally far away from other values in a dataset. Outliers can be problematic because they can affect the results of an analysis.
One common way to find outliers in a dataset is to use the interquartile range.
The interquartile range, often abbreviated IQR, is the difference between the 25th percentile (Q1) and the 75th percentile (Q3) in a dataset. It measures the spread of the middle 50% of values.
One popular method is to declare an observation to be an outlier if it has a value 1.5 times greater than the IQR or 1.5 times less than the IQR.
This tutorial provides a step-by-step example of how to find outliers in a dataset using this method.
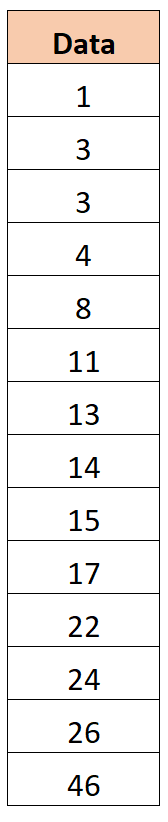
Step 1: Create the Data
Suppose we have the following dataset:
Step 2: Identify the First and Third Quartile
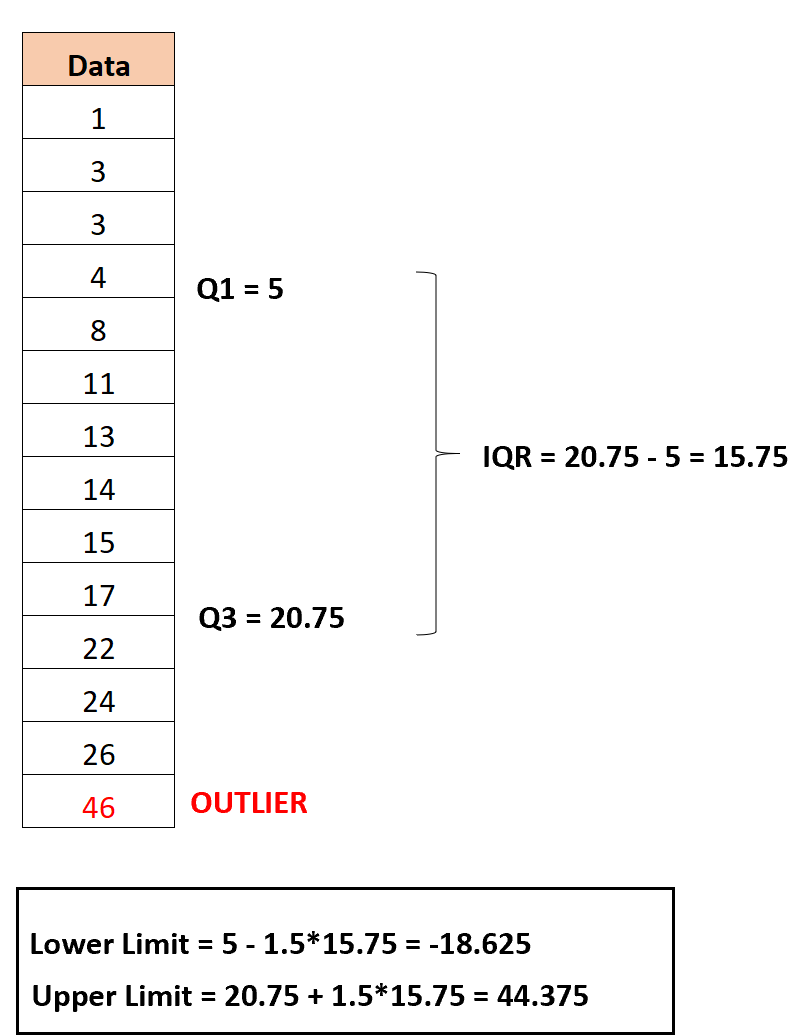
The first quartile turns out to be 5 and the third quartile turns out to be 20.75.
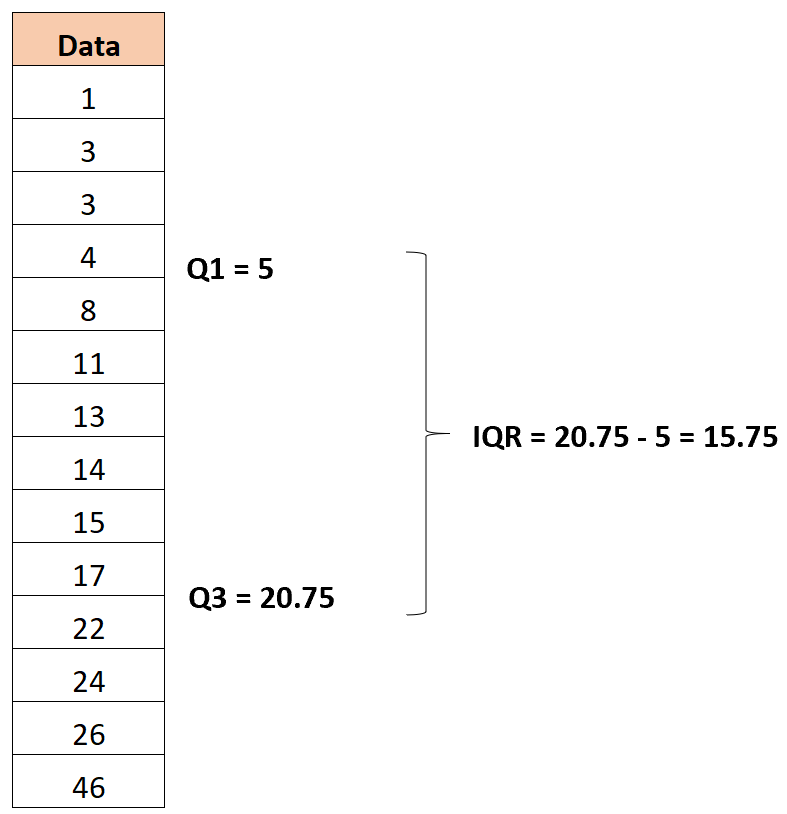
Thus, the interquartile range turns out to be 20.75 -5 = 15.75.
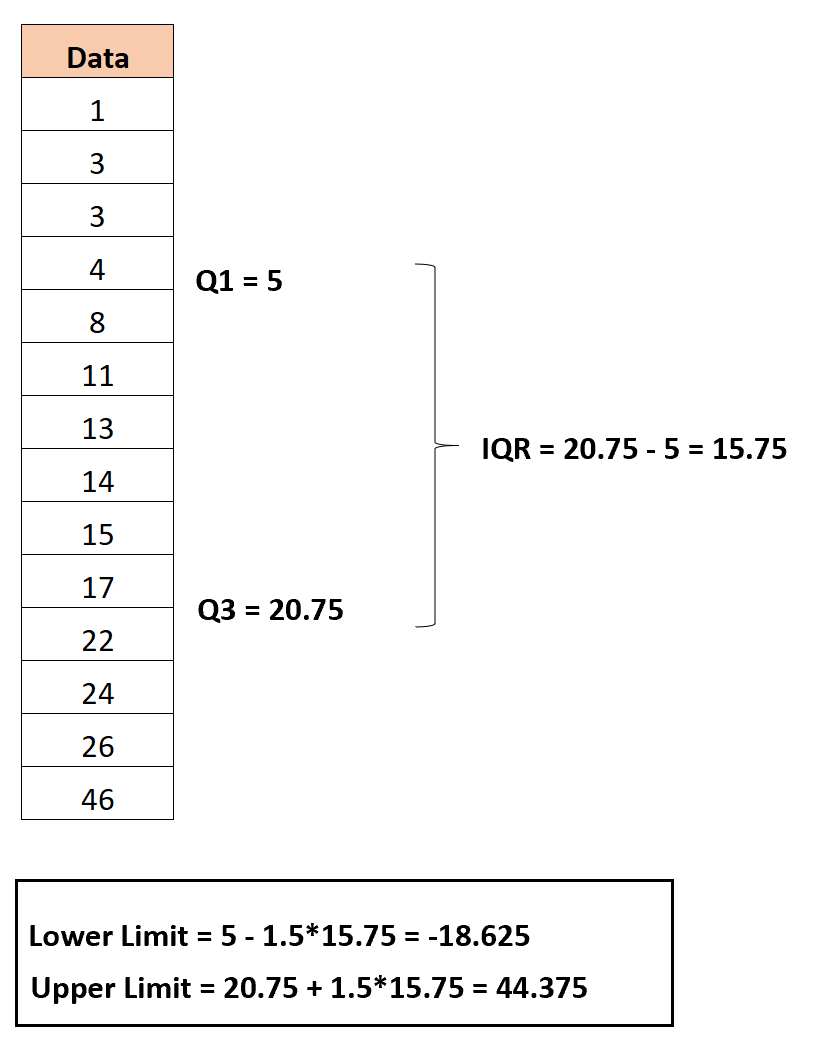
Step 3: Find the Lower and Upper Limits
The lower limit is calculated as:
Lower limit = Q1 – 1.5*IQR = 5 – 1.5*15.75 = -18.625
And the upper limited is calculated as:
Upper limit = Q3 + 1.5*IQR = 20.75 + 1.5*15.75 = 44.375
Step 4: Identify the Outliers
The only observation in the dataset with a value less than the lower limit or greater than the upper limit is 46. Thus, this is the only outlier in this dataset.
Note: You can use this Outlier Boundary Calculator to automatically find the upper and lower boundaries for outliers in a given dataset.
How to Find Outliers in Practice
The following tutorials explain how to find outliers using the interquartile range in different statistical software:
How to Find Outliers in Excel
How to Find Outliers in R
How to Find Outliers in Python
How to Find Outliers in SPSS