An ANCOVA (“analysis of covariance”) is used to determine whether or not there is a statistically significant difference between the means of three or more independent groups, after controlling for one or more covariates.
This tutorial explains how to perform an ANCOVA in Excel.
Example: ANCOVA in Excel
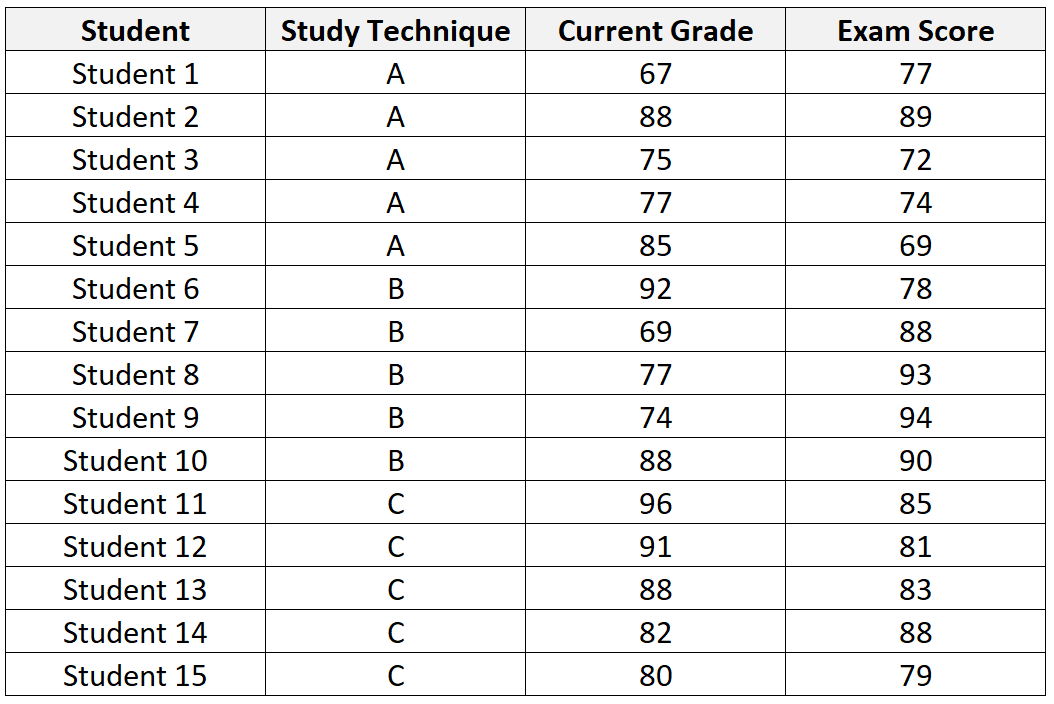
A teacher wants to know if three different studying techniques have an impact on exam scores, but she wants to account for the current grade that the student already has in the class.
She will perform an ANCOVA using the following variables:
- Factor variable: studying technique
- Covariate: current grade
- Response variable: exam score
The following table shows the dataset for the 15 students that were recruited to participate in the study:
Use the following steps to perform an ANCOVA on this dataset:
Step 1: Input the data.
First, input the data in the following format:
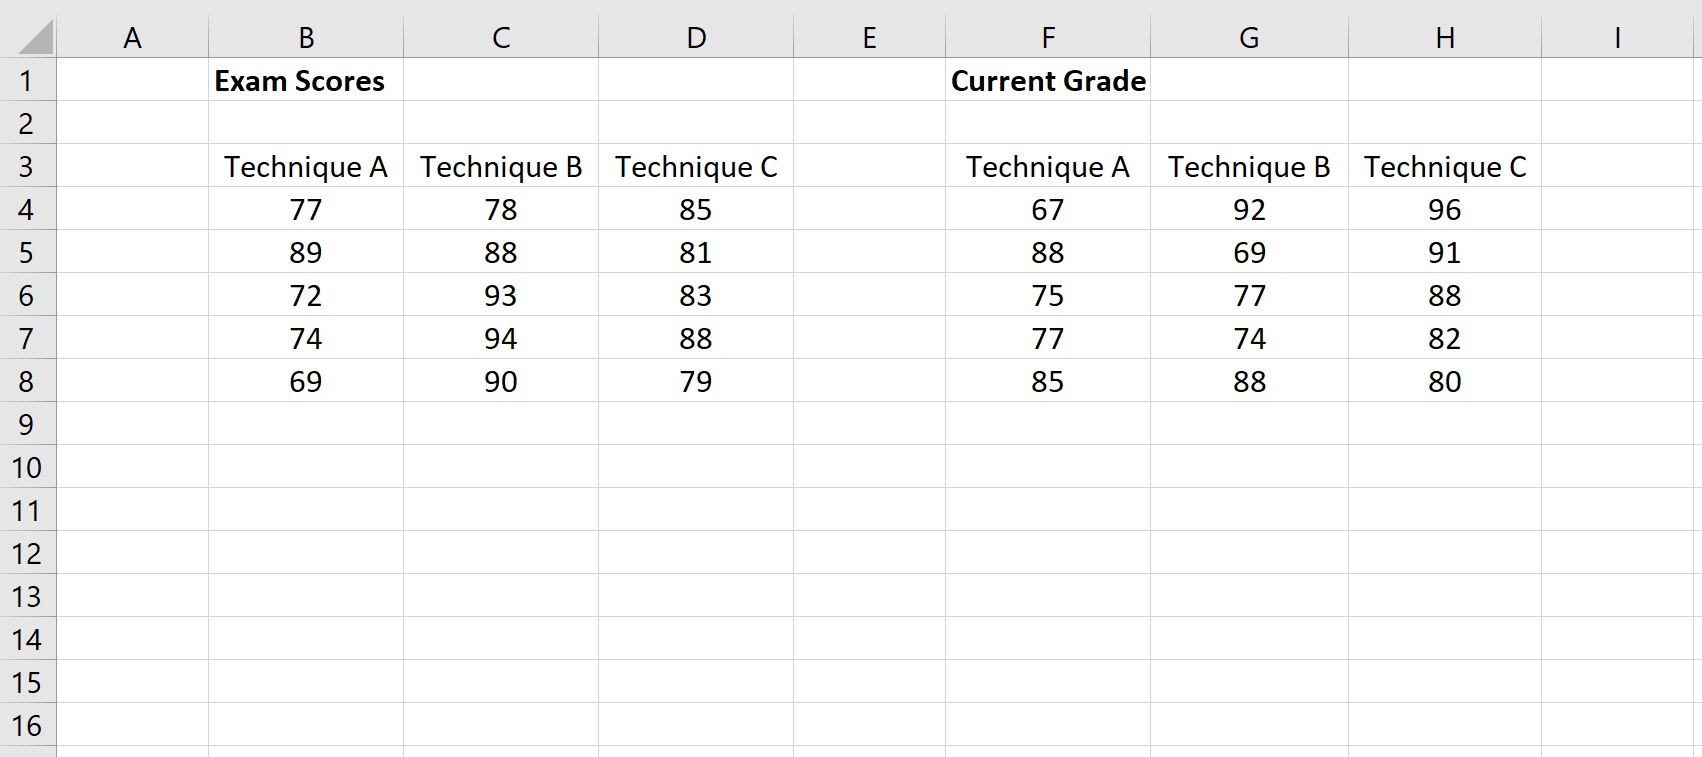
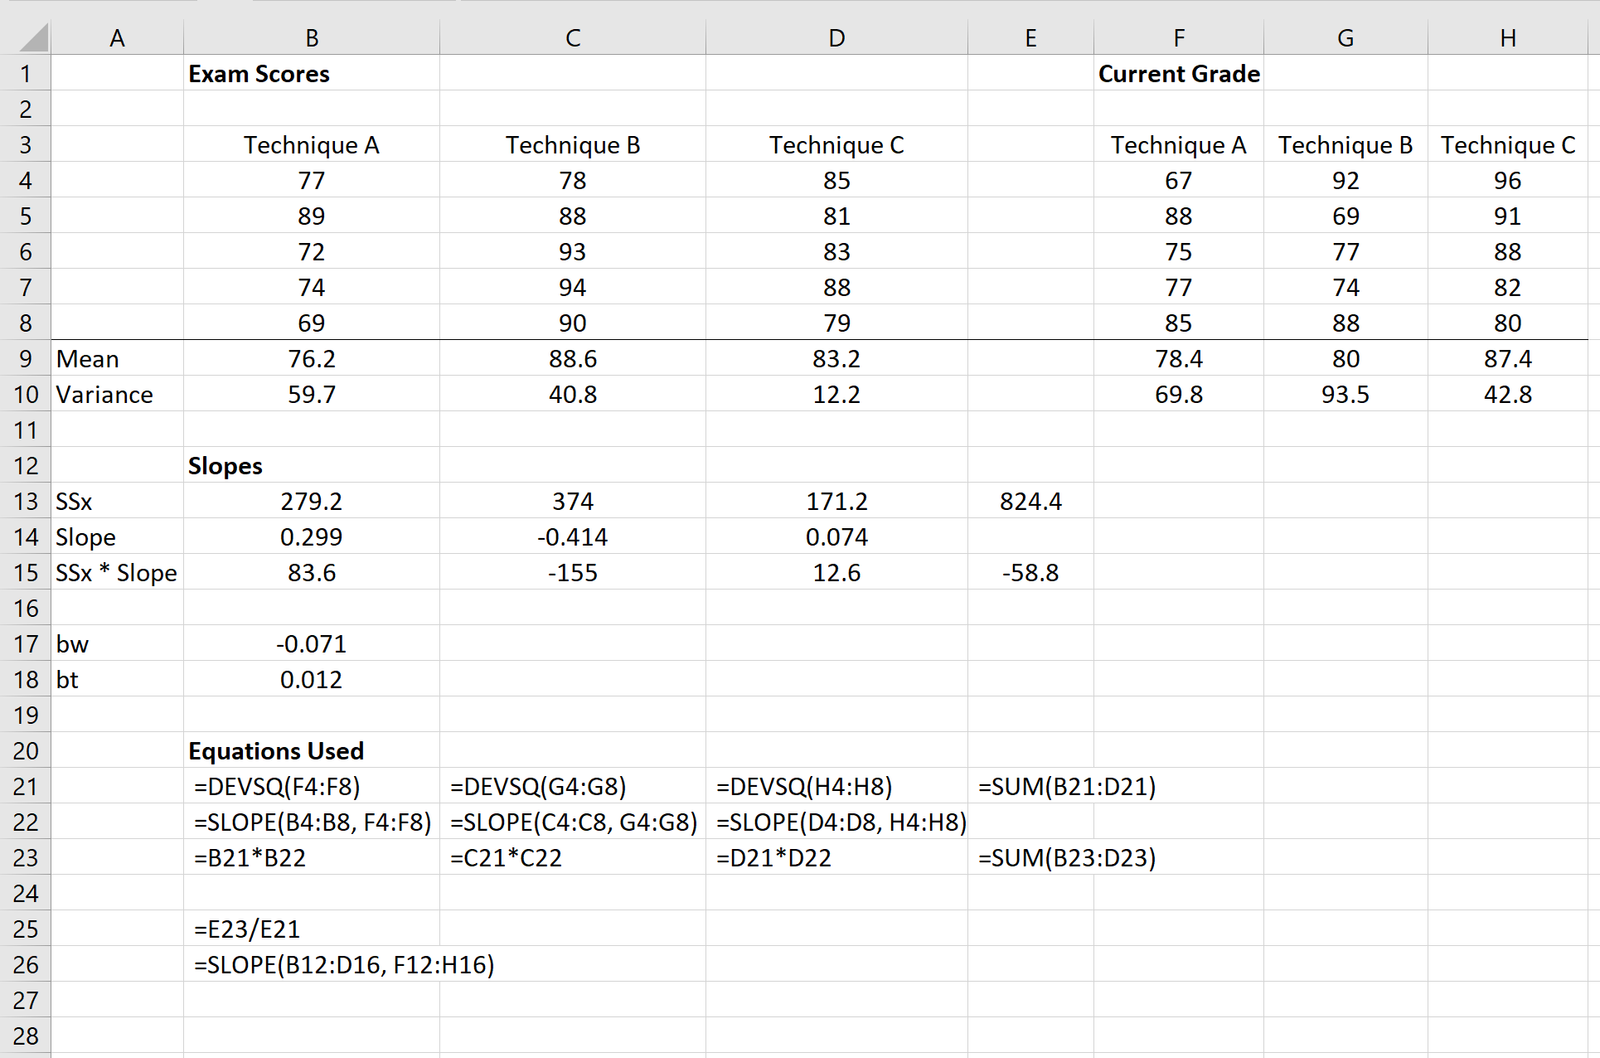
Step 2: Calculate the mean and variance for each column.
Next, calculate the mean and variance for each column:

Step 3: Calculate the slopes of the regression lines.
Next, we will calculate the slopes of the regression lines of the exam scores for each studying technique.
Note: Cells B21:E28 display the formulas used to obtain the values in cells B13:E19.
Step 4: Perform a one-way ANOVA on Exam Scores and Current Grade separately.
Next, we will perform a one-way ANOVA on the exam scores:
Reference: How to Perform a One-Way ANOVA in Excel

Then, we will perform a one-way ANOVA on the current grades:

Step 5: Fill in the ANCOVA table.
Next, we will fill in the ANCOVA table.
Note: Cells H39:M43 show the formulas used to obtain the values in cells B39:F43.
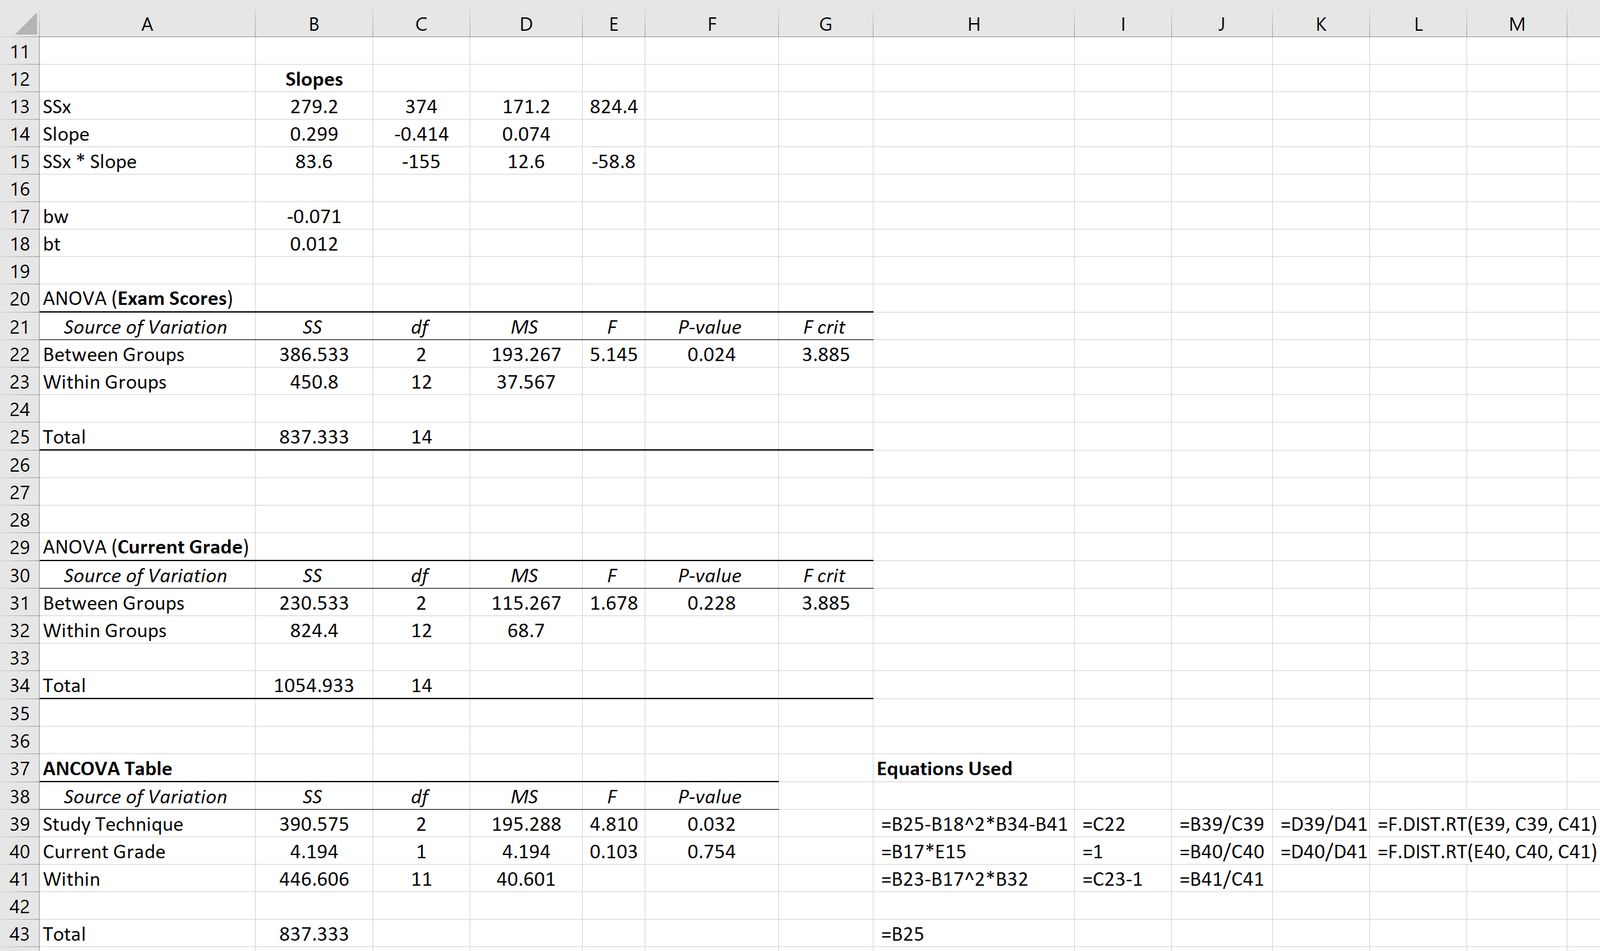
Step 6: Interpret the results.
From the ANCOVA table we see that the p-value for study technique is 0.032. Since this value is less than 0.05, we can reject the null hypothesis that each of the studying techniques leads to the same average exam score, even after accounting for the student’s current grade in the class.