You can use the linestyle argument within the lineplot() function to adjust the style of a line in a seaborn lineplot:
import seaborn as sns

sns.lineplot(data=df, x='x_var', y='y_var', linestyle='dashed')
The most common styles to provide in the linestyle argument include:
- solid (default)
- dashed
- dotted
- dashdot
The following example shows how to change the line style in a seaborn lineplot in practice.
Example: Change Line Style in Seaborn
Suppose we have the following pandas DataFrame that contains information about the sales made each day at some retail store:
import pandas as pd

#create DataFrame
df = pd.DataFrame({'day': [1, 2, 3, 4, 5, 6, 7, 8, 9, 10],
                   'sales': [3, 3, 5, 4, 5, 6, 8, 9, 14, 18]})

#view DataFrame
print(df)

   day  sales
0    1      3
1    2      3
2    3      5
3    4      4
4    5      5
5    6      6
6    7      8
7    8      9
8    9     14
9   10     18
We can use the lineplot() function in seaborn to create a line plot with a solid line:
import seaborn as sns

#create line plot with default line width
sns.lineplot(data=df, x='day', y='sales')

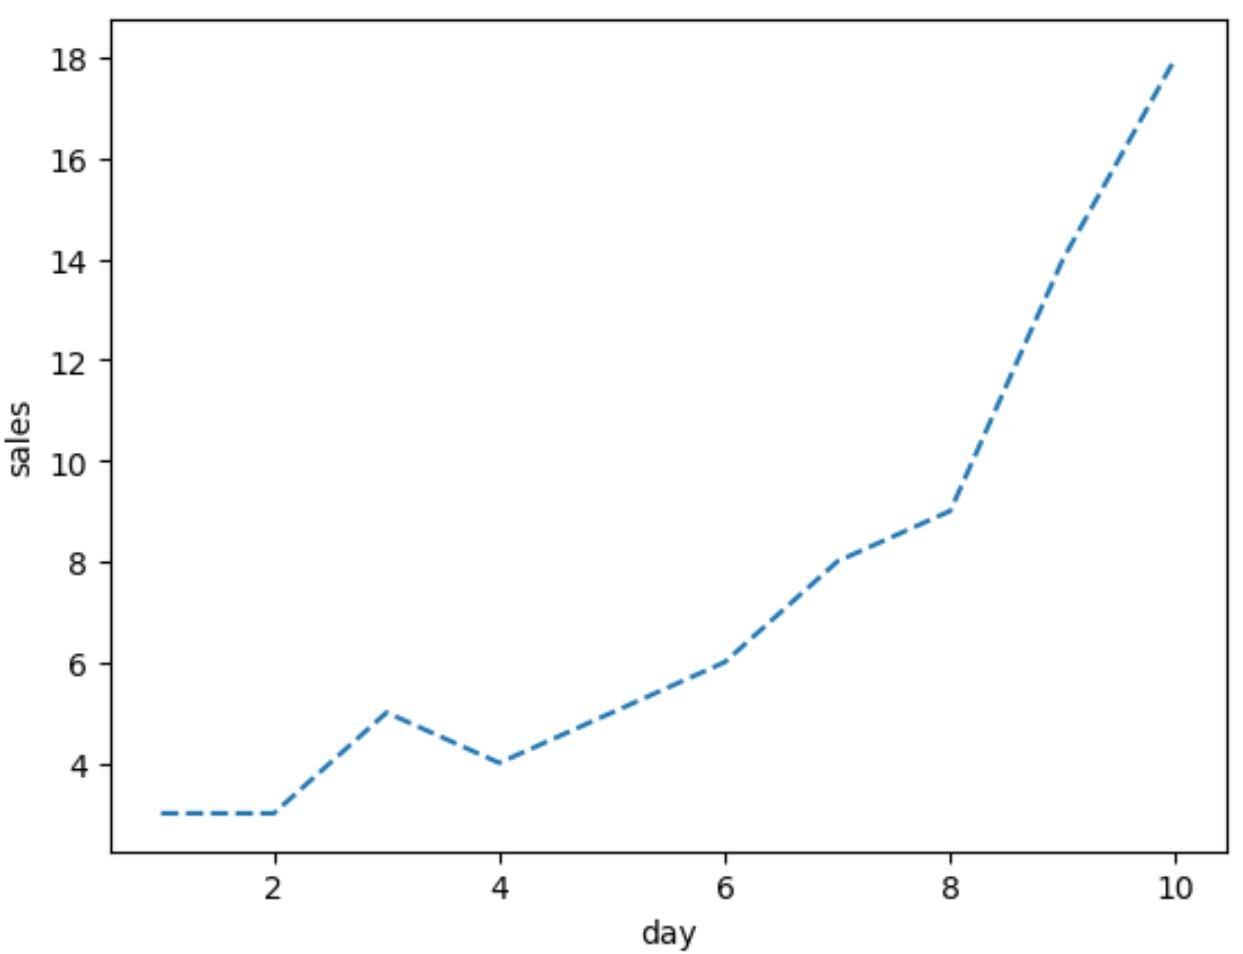
We can also use the linestyle argument to instead use a dashed line:
import seaborn as sns

#create line plot with dashed line
sns.lineplot(data=df, x='day', y='sales', linestyle='dashed')
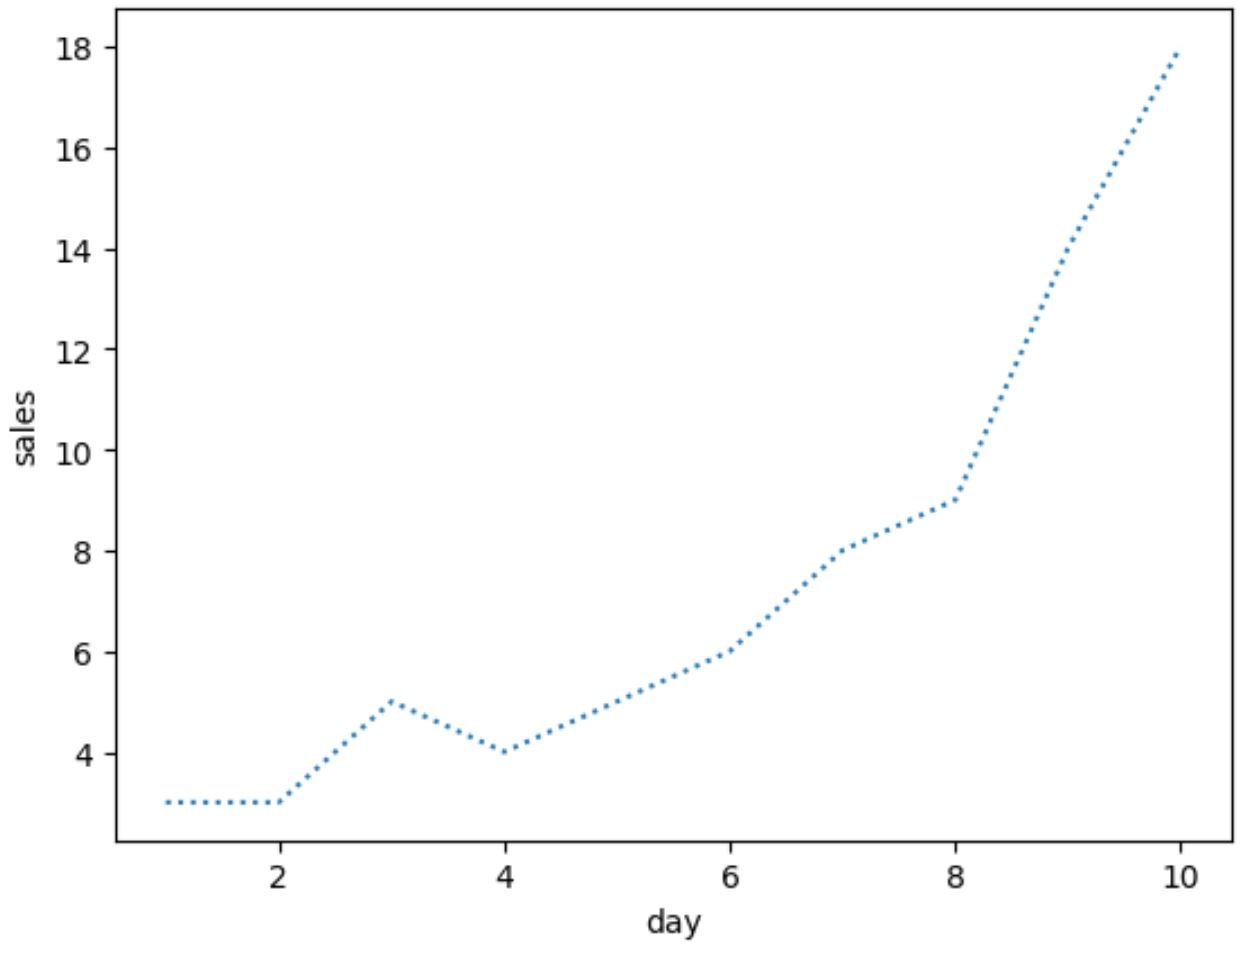
Or we could use the linestyle argument to instead use a dotted line:
import seaborn as sns

#create line plot with dotted line
sns.lineplot(data=df, x='day', y='sales', linestyle='dotted')
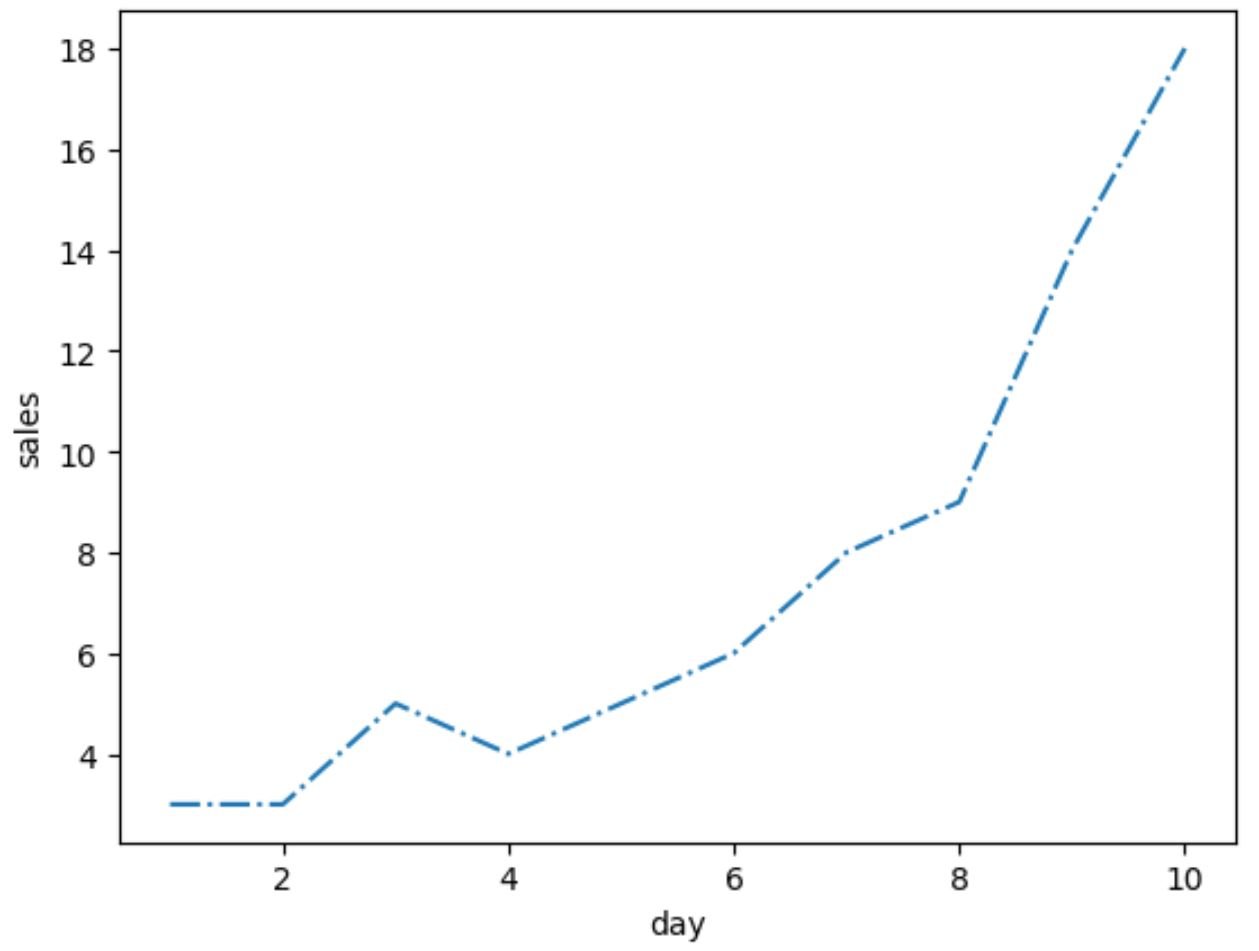
Or we could use the linestyle argument to instead use a dashdot line:
import seaborn as sns

#create line plot with dashdot line
sns.lineplot(data=df, x='day', y='sales', linestyle='dashdot')
Also note that if you create a seaborn plot with multiple lines, the linestyle argument will affect the style of each line in the plot.
Additional Resources
The following tutorials explain how to perform other common tasks in seaborn:
How to Change the Colors in a Seaborn Lineplot
How to Adjust Line Thickness in Seaborn
How to Plot Multiple Lines in Seaborn