You can use the runif() function to generate random values from a uniform distribution in R.
This function uses the following syntax:
runif(n, min=0, max=1)
where:
- n: The number of random values to generate
- min: The minimum value of the distribution (default is 0)
- max: The maximum value of the distribution (default is 1)
The following examples show how to use the runif() function in different scenarios.
Example 1: Use runif() to Generate Random Values
The following code shows how to use the runif() function to generate 10 random values from a uniform distribution that ranges from 50 to 100:
#make this example reproducible
set.seed(5)

#generate 10 random values from uniform distribution
runif(n=10, min=50, max=100)

[1] 60.01072 84.26093 95.84379 64.21997 55.23251 85.05287 76.39800 90.39676
[9] 97.82501 55.52265
Note that each of the 10 random values generated is between 50 and 100.
Example 2: Use runif() to Generate Random Values Rounded to Decimal Place
The following code shows how to use the round() function with the runif() function to generate 10 random values from a uniform distribution that ranges from 50 to 100, in which each value is rounded to one decimal place:
#make this example reproducible
set.seed(5)

#generate 10 random values from uniform distribution rounded to one decimal place
round(runif(n=10, min=50, max=100), 1)

[1] 63.7 74.5 65.9 78.0 63.1 60.1 69.4 94.4 77.7 92.1
Note that each of the 10 random values generated is between 50 and 100 and is rounded to one decimal place.
Example 3: Use runif() to Generate Random Values Rounded to Whole Numbers
The following code shows how to use the round() function with the runif() function to generate 10 random values from a uniform distribution that ranges from 50 to 100, in which each value is rounded to a whole number:
#make this example reproducible
set.seed(5)

#generate 10 random values from uniform distribution rounded to whole number
round(runif(n=10, min=50, max=100), 0)

[1] 64 75 66 78 63 60 69 94 78 92
Note that each of the 10 random values generated is between 50 and 100 and is rounded to a whole number.
Example 4: Use runif() to Create Histogram of Uniform Distribution
The following code shows how to use the runif() function to generate 1,000 random values from a uniform distribution that ranges from 50 to 100, and then use the hist() function to create a histogram that visualizes this distribution of values.
#make this example reproducible
set.seed(5)

#generate 1,000 random values from uniform distribution
values 1000, min=50, max=100)

#generate histogram to visualize these values
hist(values)
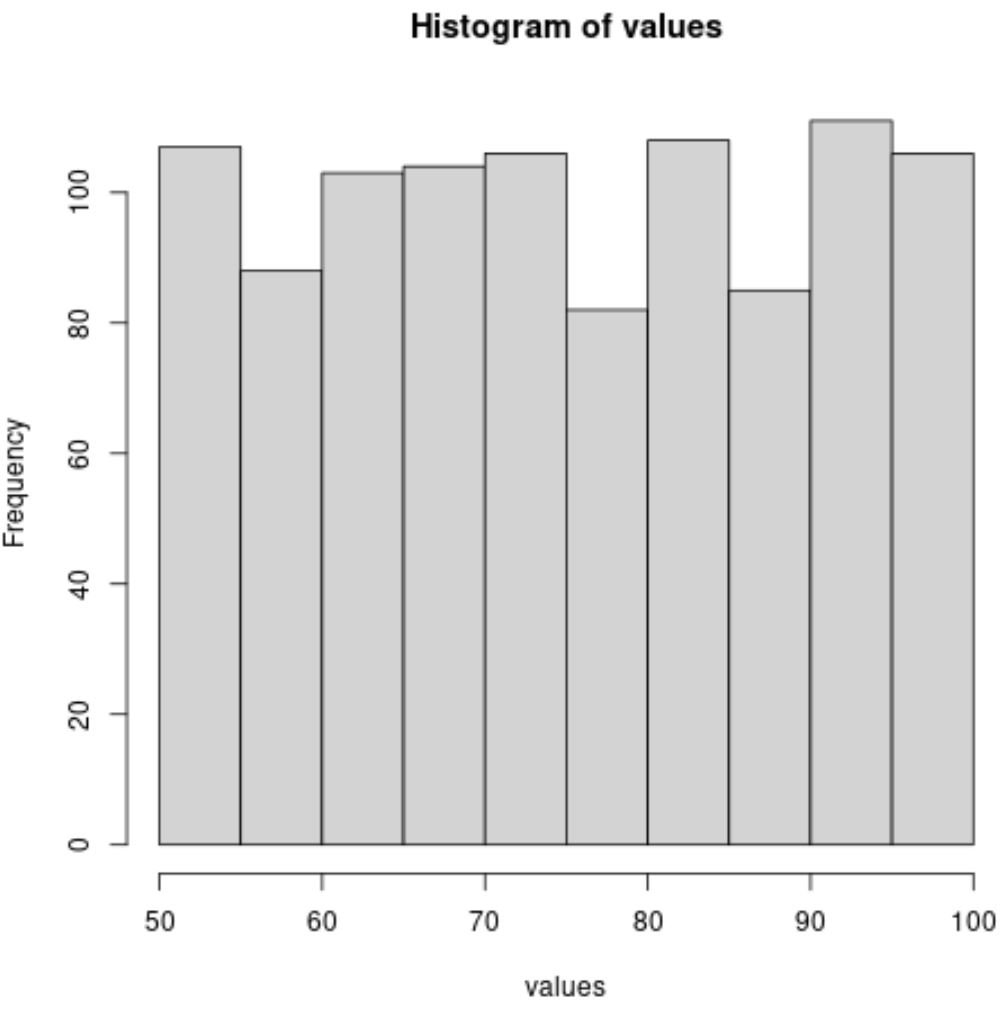
The result is a histogram that displays the distribution of the 1,000 values generated from the uniform distribution.
Additional Resources
The following tutorials explain how to perform other common tasks in R:
How to Plot a Uniform Distribution in R
How to Select Random Samples in R