Regression models are used to quantify the relationship between one or more predictor variables and a response variable.
Whenever we fit a regression model, we want to understand how well the model “fits” the data. In other words, how well is the model able to use the values of the predictor variables to predict the value of the response variable?
Two metrics that statisticians often use to quantify how well a model fits a dataset are the root mean squared error (RMSE) and the R-squared (R2), which are calculated as follows:
RMSE: A metric that tells us how far apart the predicted values are from the observed values in a dataset, on average. The lower the RMSE, the better a model fits a dataset.
It is calculated as:
RMSE = √Σ(Pi – Oi)2 / n
where:
- Σ is a symbol that means “sum”
- Pi is the predicted value for the ith observation
- Oi is the observed value for the ith observation
- n is the sample size
R2: A metric that tells us the proportion of the variance in the response variable of a regression model that can be explained by the predictor variables. This value ranges from 0 to 1. The higher the R2 value, the better a model fits a dataset.
It is calculated as:
R2 = 1 – (RSS/TSS)
where:
- RSS represents the sum of squares of residuals
- TSS represents the total sum of squares
RMSE vs. R2: Which Metric Should You Use?
When assessing how well a model fits a dataset, it’s useful to calculate both the RMSE and the R2 value because each metric tells us something different.
One one hand, RMSE tells us the typical distance between the predicted value made by the regression model and the actual value.
On the other hand, R2 tells us how well the predictor variables can explain the variation in the response variable.
For example, suppose we have the following dataset that shows information about houses in a certain city:
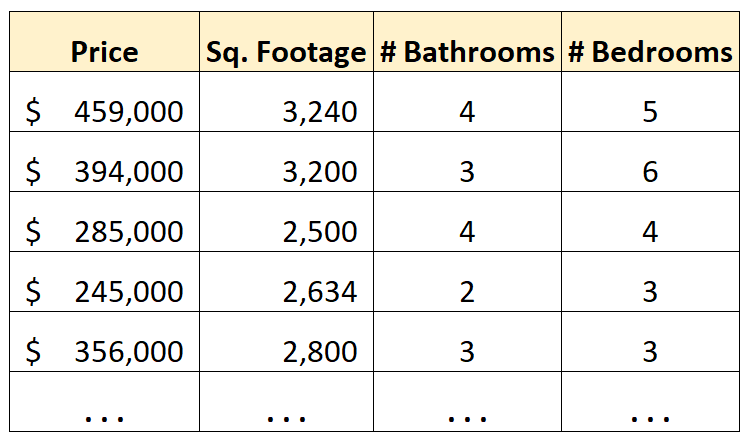
Now suppose we’d like to use square footage, number of bathrooms, and number of bedrooms to predict house price.
We can fit the following regression model:
Price = β0 + β1(sq. footage) + β2(# bathrooms) + β3(# bedrooms)
Now suppose we fit this model and then calculate the following metrics to assess the goodness of fit of the model:
- RMSE: 14,342
- R2: 0.856
The RMSE value tells us that the average deviation between the predicted house price made by the model and the actual house price is $14,342.
The R2 value tells us that the predictor variables in the model (square footage, # bathrooms, and # bedrooms) are able to explain 85.6% of the variation in the house prices.
When determining if these values are “good” or not, we can compare these metrics to alternative models.
For example, suppose we fit another regression model that uses a different set of predictor variables and calculate the following metrics for that model:
- RMSE: 19,355
- R2: 0.765
We can see that the RMSE value for this model is greater than the previous model. We can also see that the R2 value for this model is less than the previous model. This tells us that this model fits the data worse than the previous model.
Summary
Here are the main points made in this article:
- Both RMSE and R2 quantify how well a regression model fits a dataset.
- The RMSE tells us how well a regression model can predict the value of the response variable in absolute terms while R2 tells us how well a model can predict the value of the response variable in percentage terms.
- It’s useful to calculate both the RMSE and R2 for a given model because each metric gives us useful information.
Additional Resources
Introduction to Multiple Linear Regression
R vs. R-Squared: What’s the Difference?
What is a Good R-squared Value?