You can use the following basic syntax to remove a legend from a plot in Matplotlib:
import matplotlib.pyplot as plt

plt.legend('', frameon=False)
The quotation marks ‘ ‘ tell Matplotlib to place no variables in the legend and the frameon argument tells Matplotlib to remove the frame around the legend.
The following example shows how to use this syntax in practice.
Example: Remove a Legend in Matplotlib
Suppose we have the following pandas DataFrame that contains information about various basketball players:
import pandas as pd

#create DataFrame
df = pd.DataFrame({'team': ['A', 'A', 'A', 'A', 'B', 'B', 'B', 'B'],
                   'position': ['G', 'G', 'F', 'F', 'G', 'F', 'F', 'F'],
                   'points': [5, 7, 7, 9, 12, 9, 9, 4]})

#view DataFrame
print(df)

  team position  points
0    A        G       5
1    A        G       7
2    A        F       7
3    A        F       9
4    B        G      12
5    B        F       9
6    B        F       9
7    B        F       4
We can use the following code to create a stacked bar chart to visualize the total points scored by players on each team and each position:
import matplotlib.pyplot as plt

#create stacked bar chart
df.groupby(['team', 'position']).size().unstack().plot(kind='bar', stacked=True)

Notice that Matplotlib places a legend in the top right corner by default.
To create this same plot without the legend, we can use the following code:
import matplotlib.pyplot as plt

#create stacked bar chart
df.groupby(['team', 'position']).size().unstack().plot(kind='bar', stacked=True)

#remove legend
plt.legend('', frameon=False)
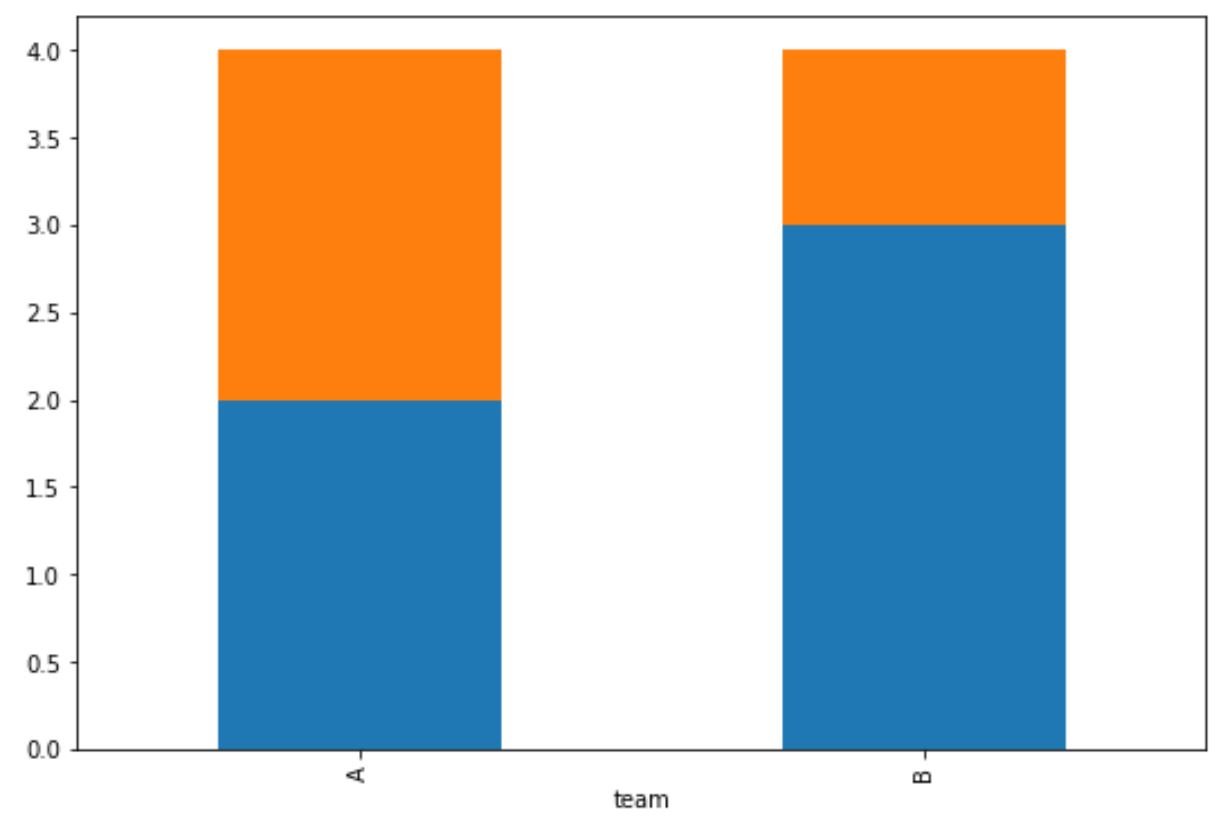
This stacked bar chart matches the previous chart, but the legend has been removed.
Also note that we can use the same syntax to remove a legend from any plot in Matplotlib.
For example, the following code shows how to create a pie chart in Matplotlib and remove the legend:
import matplotlib.pyplot as plt

#create pie chart that shows total points scored by team
df.groupby(['team']).sum().plot(kind='pie', y='points')

#remove legend
plt.legend('', frameon=False)
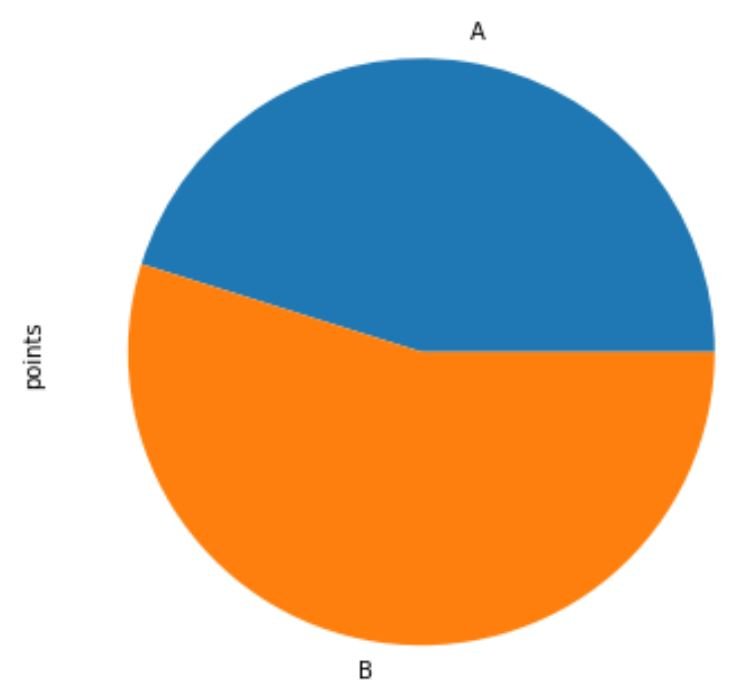
The result is a pie chart with no legend.
Additional Resources
The following tutorials explain how to perform other common tasks in Matplotlib:
How to Remove Ticks from Matplotlib Plots
How to Change Font Sizes on a Matplotlib Plot
How to Add an Average Line to Plot in Matplotlib