You can use proc tabulate in SAS to quickly display descriptive statistics for one or more variables in a tabular format.
The following examples show how to use this procedure with the following dataset that shows the total points scored by 12 different basketball players:
/*create dataset*/
data my_data;
    input team $ position $ points;
    datalines;
A Guard 15
A Guard 12
A Guard 29
A Forward 13
A Forward 9
A Forward 16
B Guard 25
B Guard 20
C Guard 34
C Forward 19
C Forward 3
C Forward 8
;
run;

/*view dataset*/
proc print data=my_data;

Example 1: Proc Tabulate with One Variable
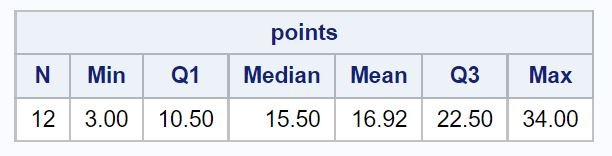
We can use the following code to calculate descriptive statistics for the points variable:
/*create table that displays descriptive stats for points variable*/
proc tabulate data=my_data;
    var points;
    table points * (N Min Q1 Median Mean Q3 Max);
run;
Note: The values inside the parenthesis tell SAS which descriptive statistics to calculate for points.
Here are some of the most commonly used descriptive statistics:
- N: The total number of observations
- Min: The minimum value
- Q1: The value for the first quantile (i.e. the 25th percentile)
- Median: The median value
- Mean: The mean value
- Q3: The value for the third quantile (i.e. the 75th percentile)
- Max: The maximum value
From the output we can see:
- The total observations is 12.
- The minimum value for points is 3.
- The number of points at the 25th percentile is 10.5.
- The median number of points is 15.5.
- The mean number of points is 16.92.
- The number of points at the 75th percentile is 22.5.
- The maximum number of points is 34.
From these five values we can gain a pretty good understanding of the distribution of values for the Weight variable.
Example 2: Proc Tabulate with Two Variables
We can use the following code to calculate descriptive statistics for the points variable, grouped by the team variable:
/*create table that displays descriptive stats for points, grouped by team*/
proc tabulate data=my_data;
    class team;
    var points;
    table team, points * (N Min Q1 Median Mean Q3 Max);
run;
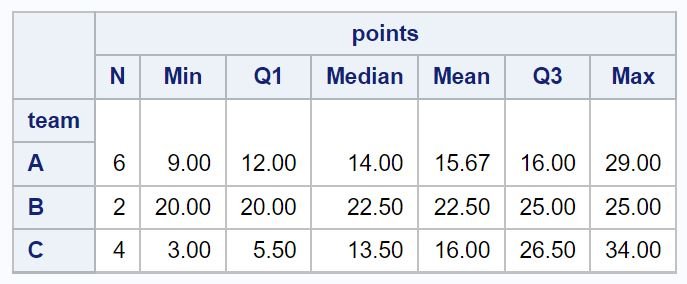
The resulting table shows the descriptive statistics of points for each of the three teams.
For example:
- Team A has 6 observations.
- The minimum value for points on team A is 9.
- The number of points on team A at the 25th percentile is 12.
- The median number of points on team A is 14.
And so on.
Example 3: Proc Tabulate with Three Variables
We can use the following code to calculate descriptive statistics for the points variable, grouped by the team and position variables:
/*create table that shows descriptive stats for points, grouped by team and position*/
proc tabulate data=my_data;
    class team position;
    var points;
    table team, position * points * (N Min Q1 Median Mean Q3 Max);
run;

The resulting table shows the descriptive statistics for points, grouped by team and position.
Note that the cells for team “B” and position “Forward” are empty because there were no players on team B who had a position of Forward.
Additional Resources
The following tutorials explain how to perform other common tasks in SAS:
How to Use Proc Summary in SAS
How to Calculate Correlation in SAS
How to Create Frequency Tables in SAS
How to Create Boxplots by Group in SAS