Interpolation is the process of estimating an unknown value of a function between two known values.
Given two known values (x1, y1) and (x2, y2), we can estimate the y-value for some point x by using the following formula:
y = y1 + (x-x1)(y2-y1)/(x2-x1)
This tutorial explains how to use linear interpolation to find some unknown y-value based on an x-value in Excel.
Example: Linear Interpolation in Excel
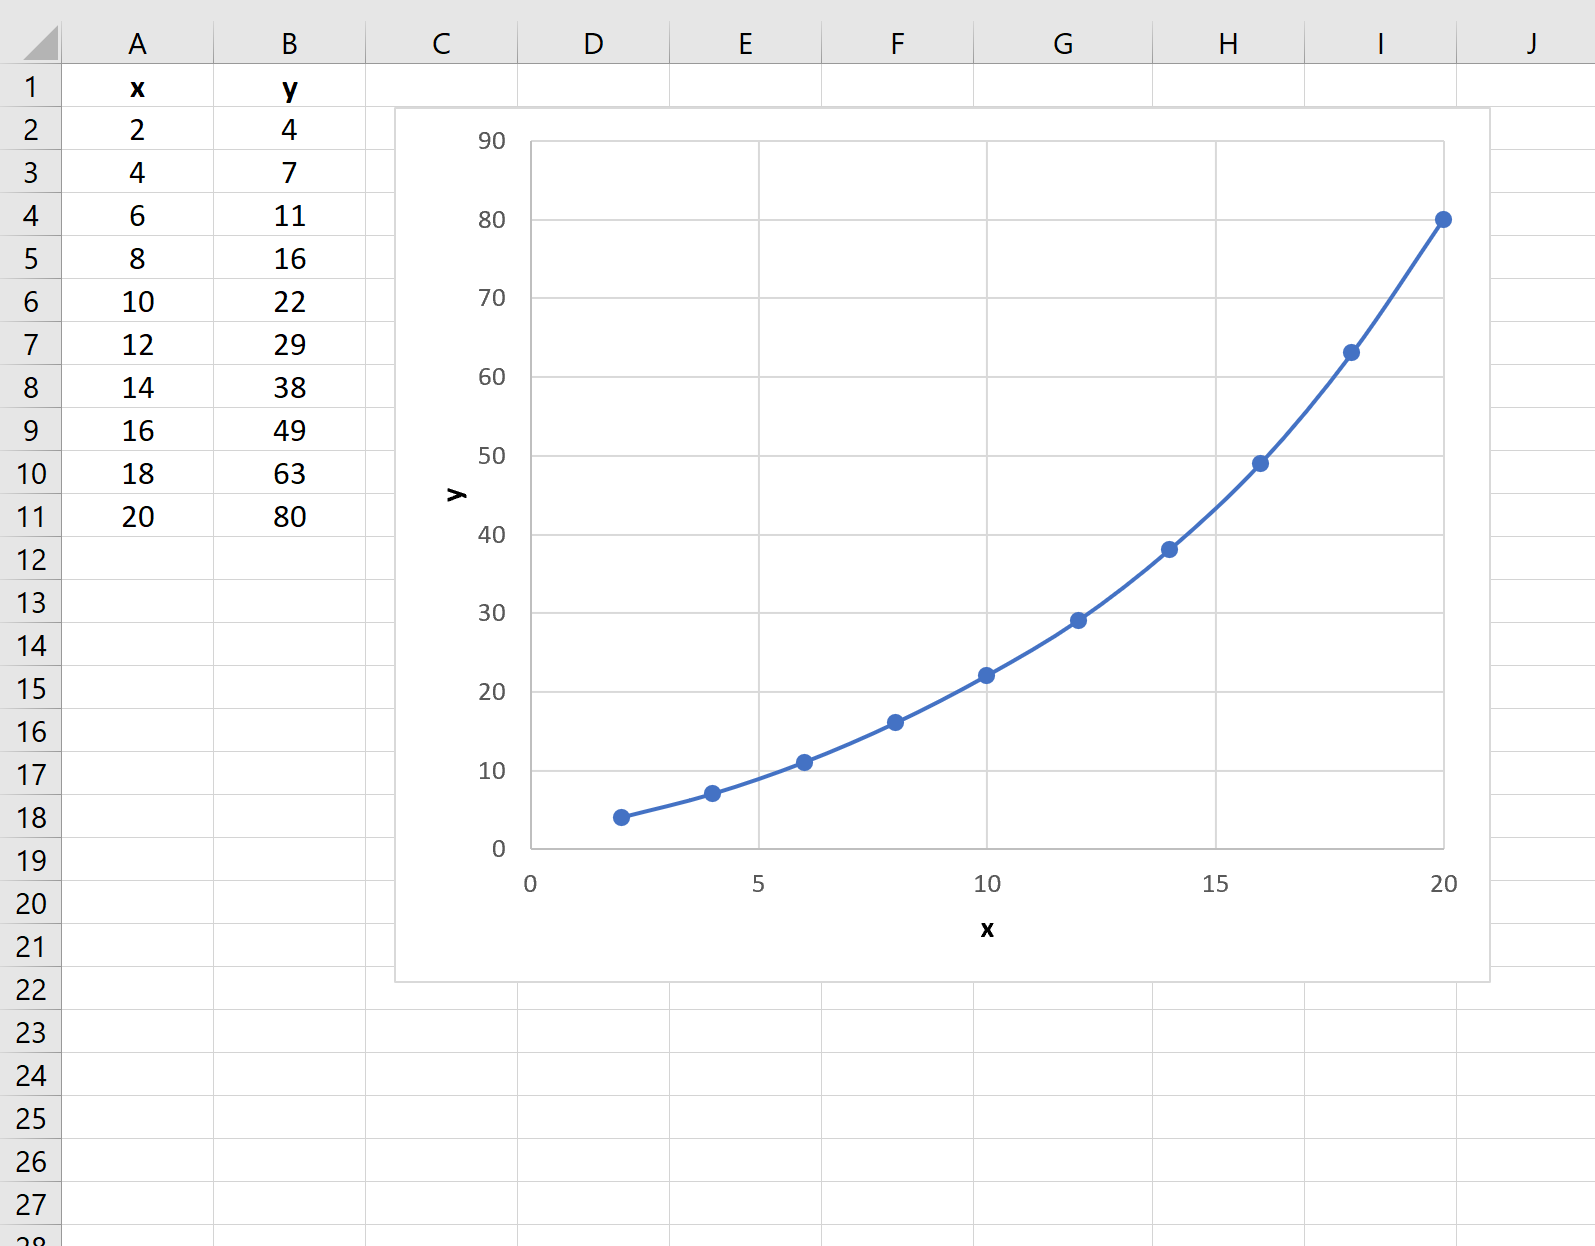
Suppose we have the following dataset in Excel:

If we create a quick plot of the data, here’s what it would look like:
Now suppose that we’d like to find the y-value associated with a new x-value of 13. We can see that we have measured y-values for x-values of 12 and 14, but not for an x-value of 13.
We can use the following formula to perform linear interpolation in Excel to find the estimated y-value:
=FORECAST(NewX,OFFSET(KnownY,MATCH(NewX,KnownX,1)-1,0,2), OFFSET(KnownX,MATCH(NewX,KnownX,1)-1,0,2))
Here’s how to use this function to estimate the y-values associated with an x-value of 13:

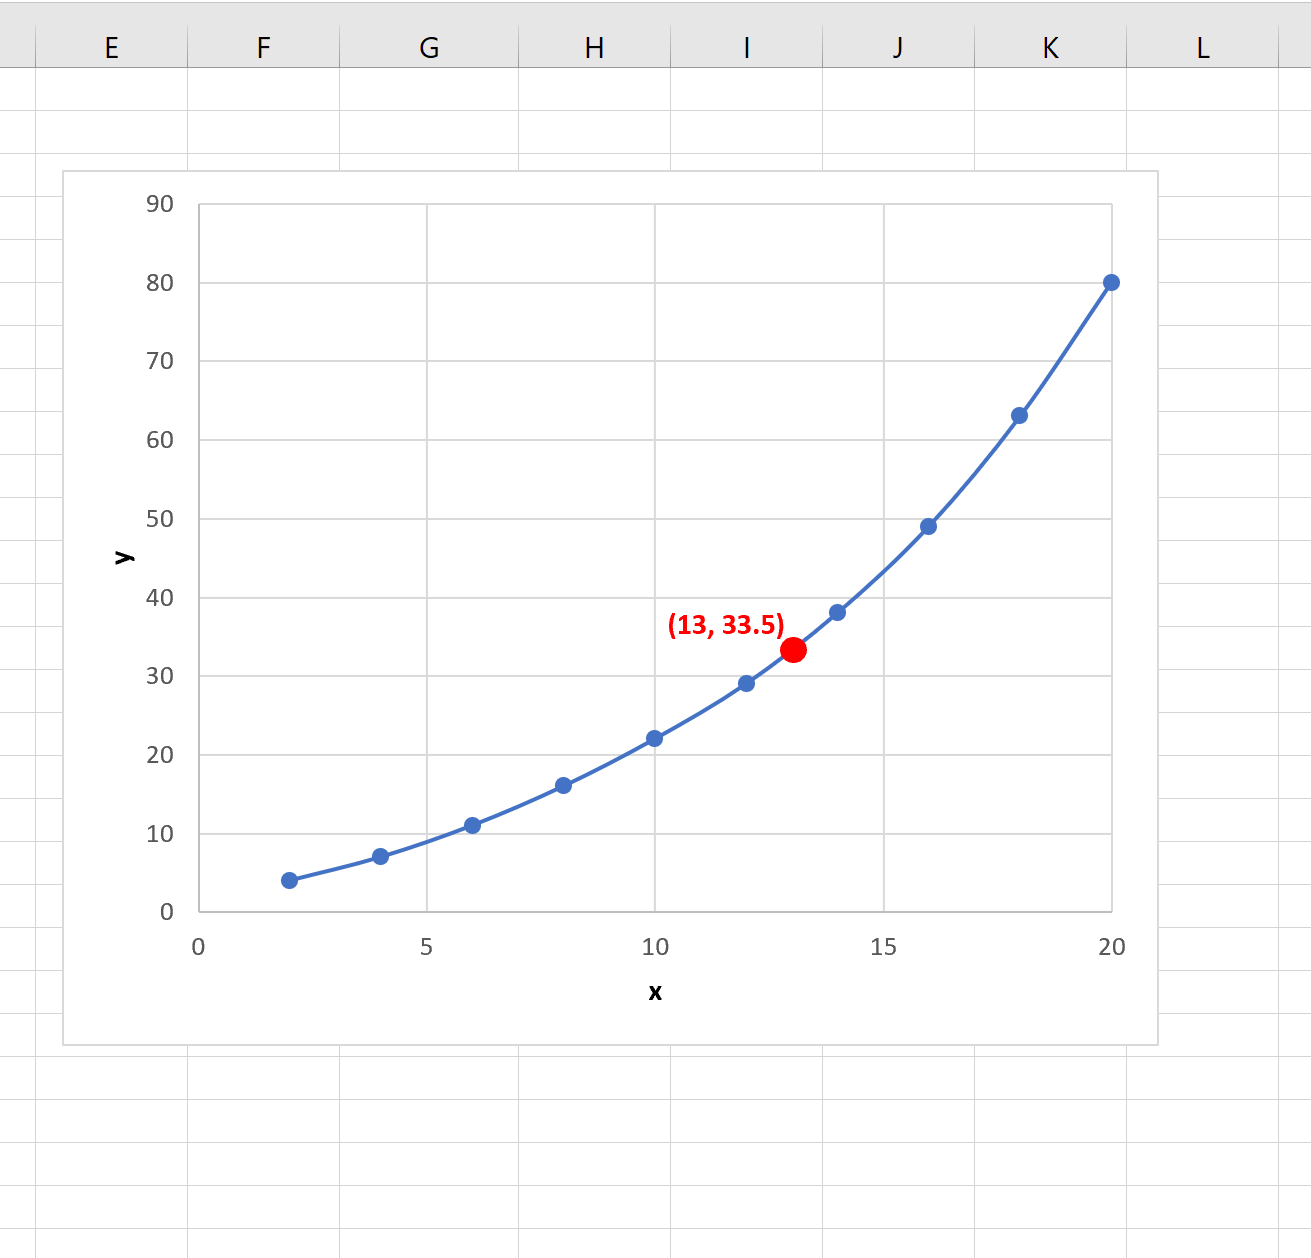
The estimated y-value turns out to be 33.5.
If we add the point (13, 33.5) to our plot, it appears to match the function quite well:
We can use this formula to estimate the y-value of any x-value by simply replacing the NewX in the formula with any new x-value.
Note that in order for this function to work, the new x-value should fall within the range of the existing x-values.
You can find more Excel tutorials here.