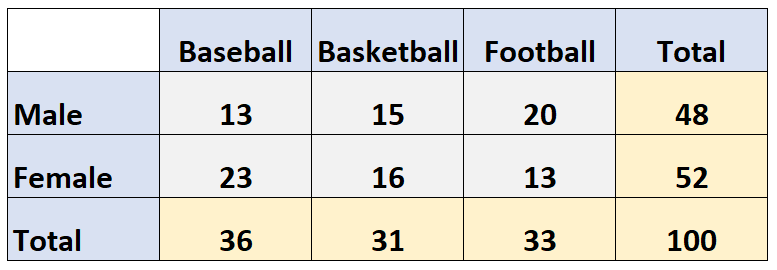
A two-way frequency table is a table that displays the frequencies for two categorical variables.
For example, the following two-way table shows the results of a survey that asked 100 people which sport they liked best: baseball, basketball, or football.
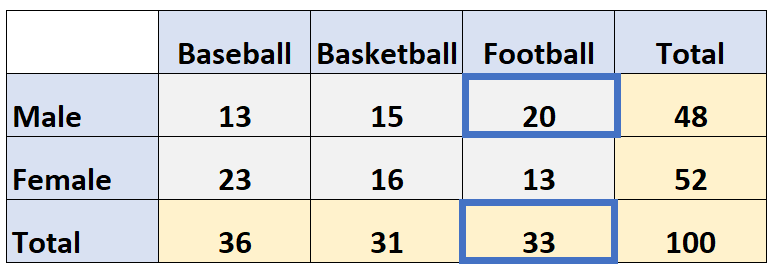
The rows display the gender of the respondent and the columns show which sport they chose:
The marginal frequencies are the frequencies shown in the margins of the table:
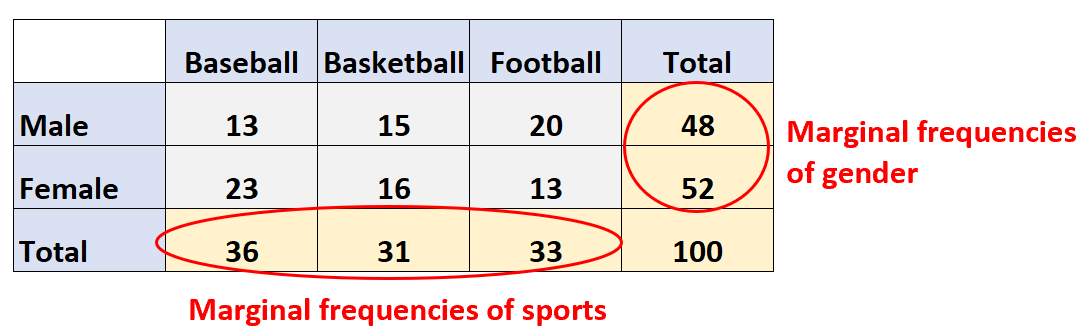
These values tell us the total values for each variable. For example:
- 36 total respondents chose baseball as their favorite sport
- 31 total respondents chose basketball as their favorite sport
- 33 total respondents chose football as their favorite sport
We can also see:
- 48 total respondents were male
- 52 total respondents were female
The joint frequencies are the frequencies shown in the cells of the table:
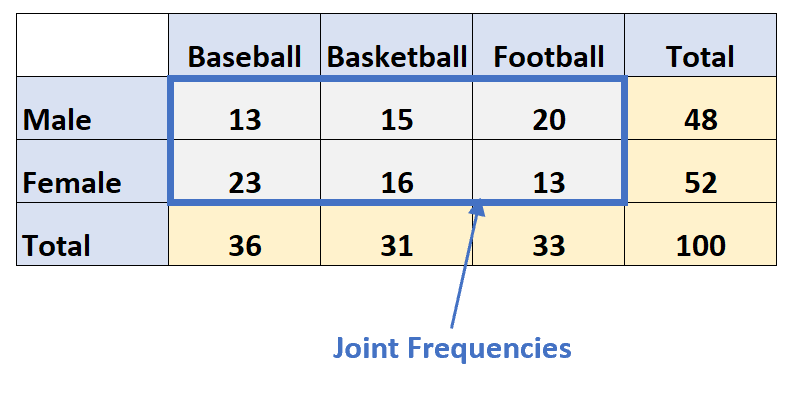
These values are known as “joint” frequencies because they tell us the frequency of two values that occur jointly.
For example, we can see:
- There were a total of 13 respondents who were male and preferred baseball.
- There were a total of 15 respondents who were male and preferred basketball.
- There were a total of 20 respondents who were male and preferred football.
- There were a total of 23 respondents who were female and preferred baseball.
- There were a total of 16 respondents who were female and preferred basketball.
- There were a total of 13 respondents who were female and preferred football.
Notice that the sum of all the joint frequencies adds up to the total number of survey respondents:
Total survey respondents = 13 + 15 + 20 + 23 + 16 + 13 = 100.
What Are Joint Relative Frequencies?
A joint relative frequency tells us the frequency of one variable relative to another variable.
For example, consider our two-way table from earlier:
Question 1: What is the joint relative frequency that a survey respondent prefers baseball, given that the respondent is a female?
To answer this, we will only consider the row that contains female responses. We’ll then take the number of females who prefer baseball and divide by the total number of females.
This turns out to be 23/52 = 0.4423 = 44.23%
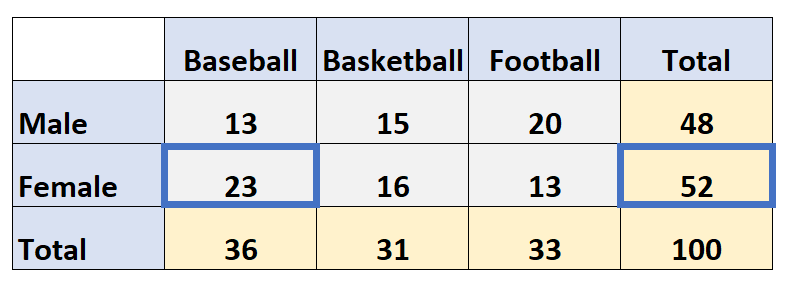
In other words, 44.23% of all female survey respondents prefer baseball as their favorite sport.
Question 2: What is the joint relative frequency that a survey respondent is male, given that they prefer football as their favorite sport?
To answer this, we will only consider the column that contains football as the favorite sport. We’ll then take the number of males who prefer football and divide by the total number of respondents who preferred football.
This turns out to be 20/33 = 0.606 = 60.6%
In other words, 60.6% of all survey respondents who prefer football are male.
Additional Resources
What is a Marginal Distribution?
What is a Conditional Distribution
What is a Joint Probability Distribution?