In statistics, there are three commonly used t-tests:
One Sample t-test: Used to compare a population mean to some value.
Two Sample t-test: Used to compare two population means.
Paired Samples t-test: Used to compare two population means when each observation in one sample can be paired with an observation in the other sample.
When performing each t-test, you’ll have to calculate a test statistic and a corresponding degrees of freedom.
Here is how to calculate the degrees of freedom for each type of test:
One Sample t-test: df = n-1 where n is the total number of observations.
Two Sample t-test: df = n1 + n2 – 2 where n1, n2 are the total observations from each sample.
Paired Samples t-test: n-1 where n is the total number of pairs.
The following examples show how to calculate the degrees of freedom for each type of t-test in practice.
Example 1: Degrees of Freedom for One Sample t-test
Suppose we want to know whether or not the mean weight of a certain species of turtle is equal to 310 pounds.
Suppose we collect a random sample of turtles with the following information:
- Sample size n = 40
- Sample mean weight x = 300
- Sample standard deviation s = 18.5
We will perform a one sample t-test with the following hypotheses:
- H0: μ = 310 (population mean is equal to 310 pounds)
- HA: μ ≠ 310 (population mean is not equal to 310 pounds)
First, we’ll calculate the test statistic:
t = (x – μ) / (s/√n) = (300-310) / (18.5/√40) = -3.4187
Next, we’ll calculate the degrees of freedom:
df = n -1 = 40 – 1 = 39
Lastly, we’ll plug in the test statistic and degrees of freedom into the T Score to P Value Calculator to find that the p-value is 0.00149.
Since this p-value is less than our significance level α = 0.05, we reject the null hypothesis. We have sufficient evidence to say that the mean weight of this species of turtle is not equal to 310 pounds.
Example 2: Degrees of Freedom for Two Sample t-test
Suppose we want to know whether or not the mean weight between two different species of turtles is equal.
Suppose we collect a random sample of turtles from each population with the following information:
Sample 1:
- Sample size n1 = 40
- Sample mean weight x1 = 300
- Sample standard deviation s1 = 18.5
Sample 2:
- Sample size n2 = 38
- Sample mean weight x2 = 305
- Sample standard deviation s2 = 16.7
We will perform a two sample t-test with the following hypotheses:
- H0: μ1 = μ2 (the two population means are equal)
- HA: μ1 ≠ μ2 (the two population means are not equal)
First, we will calculate the pooled standard deviation sp:
sp = √ (n1-1)s12 + (n2-1)s22 / (n1+n2-2) = √ (40-1)18.52 + (38-1)16.72 / (40+38-2) = 17.647
Next, we will calculate the test statistic t:
t = (x1 – x2) / sp(√1/n1 + 1/n2) = (300-305) / 17.647(√1/40 + 1/38) = -1.2508
Next, we’ll calculate the degrees of freedom:
df = n1 + n2 – 2 = 40 + 38 – 2 = 76
Lastly, we’ll plug in the test statistic and degrees of freedom into the T Score to P Value Calculator to find that the p-value is 0.21484.
Since this p-value is not less than our significance level α = 0.05, we fail to reject the null hypothesis. We do not have sufficient evidence to say that the mean weight of turtles between these two populations is different.
Example 3: Degrees of Freedom for Paired Samples t-test
Suppose we want to know whether or not a certain training program is able to increase the max vertical jump (in inches) of college basketball players.
To test this, we may recruit a simple random sample of 20 college basketball players and measure each of their max vertical jumps. Then, we may have each player use the training program for one month and then measure their max vertical jump again at the end of the month.
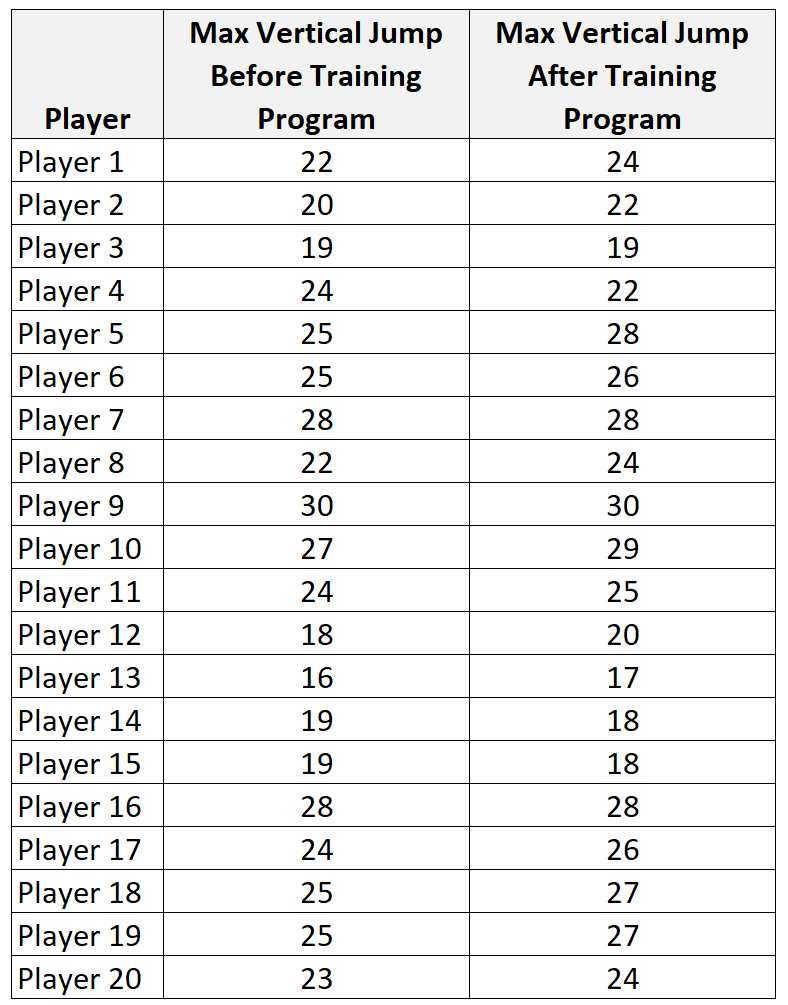
To determine whether or not the training program actually had an effect on max vertical jump, we will perform a paired samples t-test.
First, we’ll calculate the following summary data for the differences:
- xdiff: sample mean of the differences = -0.95
- s: sample standard deviation of the differences = 1.317
- n: sample size (i.e. number of pairs) = 20
We will perform a paired samples t-test with the following hypotheses:
- H0: μ1 = μ2 (the two population means are equal)
- HA: μ1 ≠ μ2 (the two population means are not equal)
Next, we’ll calculate the test statistic:
t = xdiff / (sdiff/√n) = -0.95 / (1.317/√20) = -3.226
Next, we’ll calculate the degrees of freedom:
df = n – 1 = 20 – 1 = 19
According to the T Score to P Value Calculator, the p-value associated with t = -3.226 and degrees of freedom = n-1 = 20-1 = 19 is 0.00445.
Since this p-value is less than our significance level α = 0.05, we reject the null hypothesis. We have sufficient evidence to say that the mean max vertical jump of players is different before and after participating in the training program.
Additional Resources
The following calculators can be used to automatically perform t-tests based on data that you provide:
One Sample t-test Calculator
Two Sample t-test Calculator
Paired Samples t-test Calculator