You can use the figsize argument to specify the size (in inches) of a seaborn heatmap:
#specify size of heatmap
fig, ax = plt.subplots(figsize=(15, 5))

#create seaborn heatmap
sns.heatmap(df)
The following example shows how to use this syntax in practice.
Example: Adjust Size of Heatmaps in Seaborn
For this example, we’ll use the seaborn dataset called flights, which contains the number of airline passengers who flew in each month from 1949 to 1960:
import matplotlib.pyplot as plt
import seaborn as sns

#load "flights" dataset
data = sns.load_dataset("flights")
data = data.pivot("month", "year", "passengers")

#view first five rows of dataset
print(data.head())

year   1949  1950  1951  1952  1953  1954  1955  1956  1957  1958  1959  1960
month
Jan     112   115   145   171   196   204   242   284   315   340   360   417
Feb     118   126   150   180   196   188   233   277   301   318   342   391
Mar     132   141   178   193   236   235   267   317   356   362   406   419
Apr     129   135   163   181   235   227   269   313   348   348   396   461
May     121   125   172   183   229   234   270   318   355   363   420   472
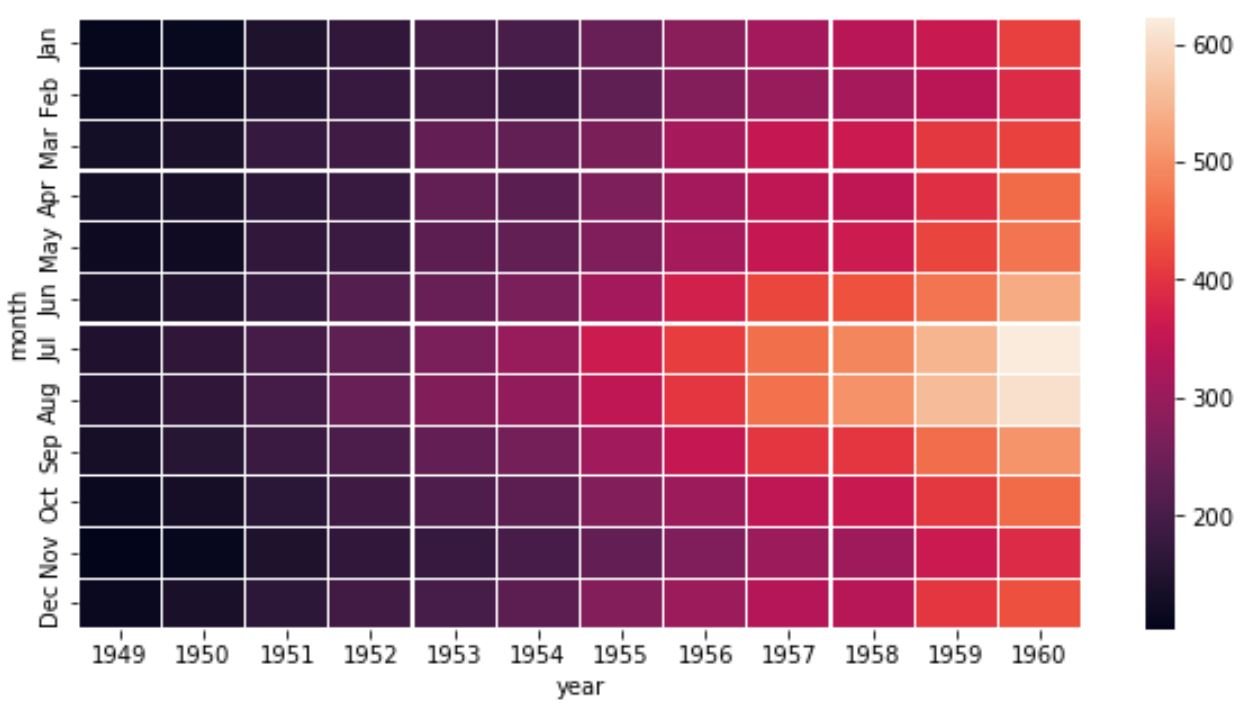
Next, we’ll create a heatmap using figsize dimensions of 10 by 10:
#specify size of heatmap
fig, ax = plt.subplots(figsize=(10, 10))

#create heatmap
sns.heatmap(data, linewidths=.3)
Notice that the heatmap has the same dimensions for the height and the width.
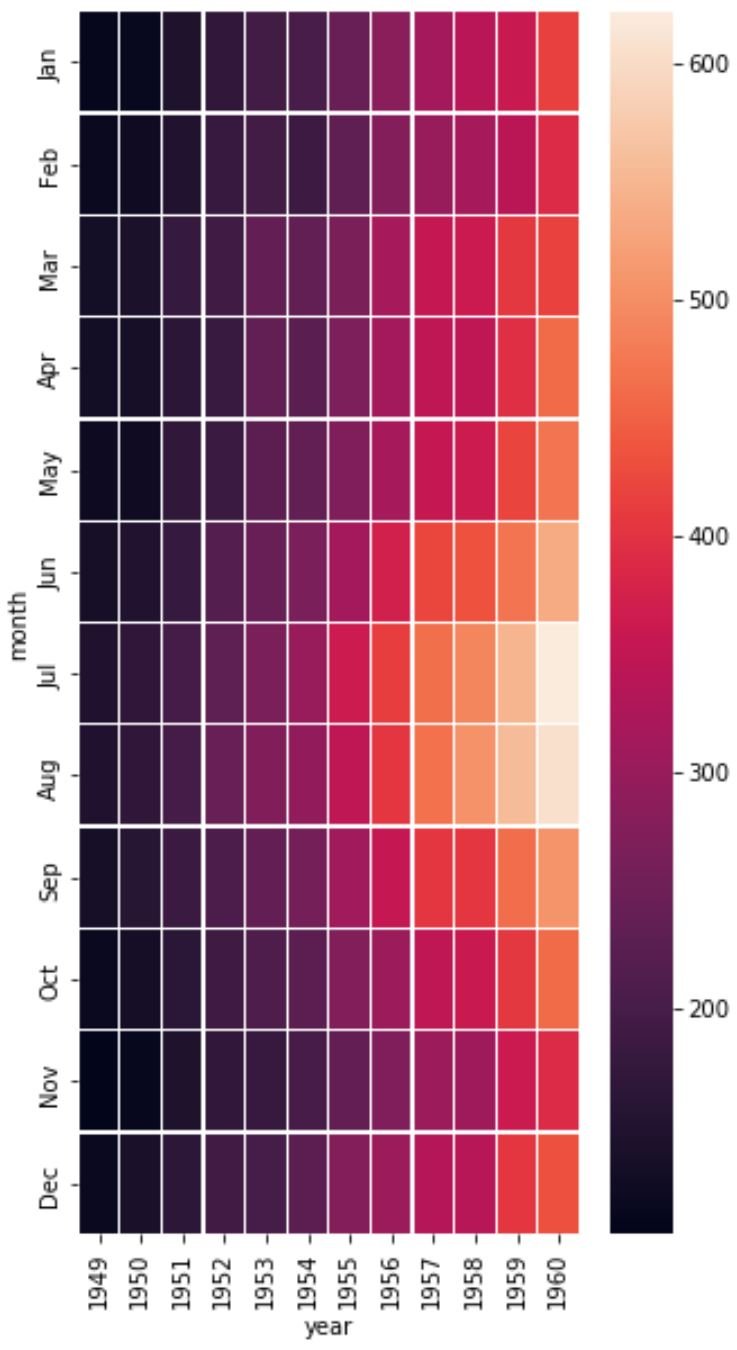
We can make the heatmap more narrow by making the first argument in figsize smaller:
#specify size of heatmap
fig, ax = plt.subplots(figsize=(5, 10))

#create heatmap
sns.heatmap(data, linewidths=.3)
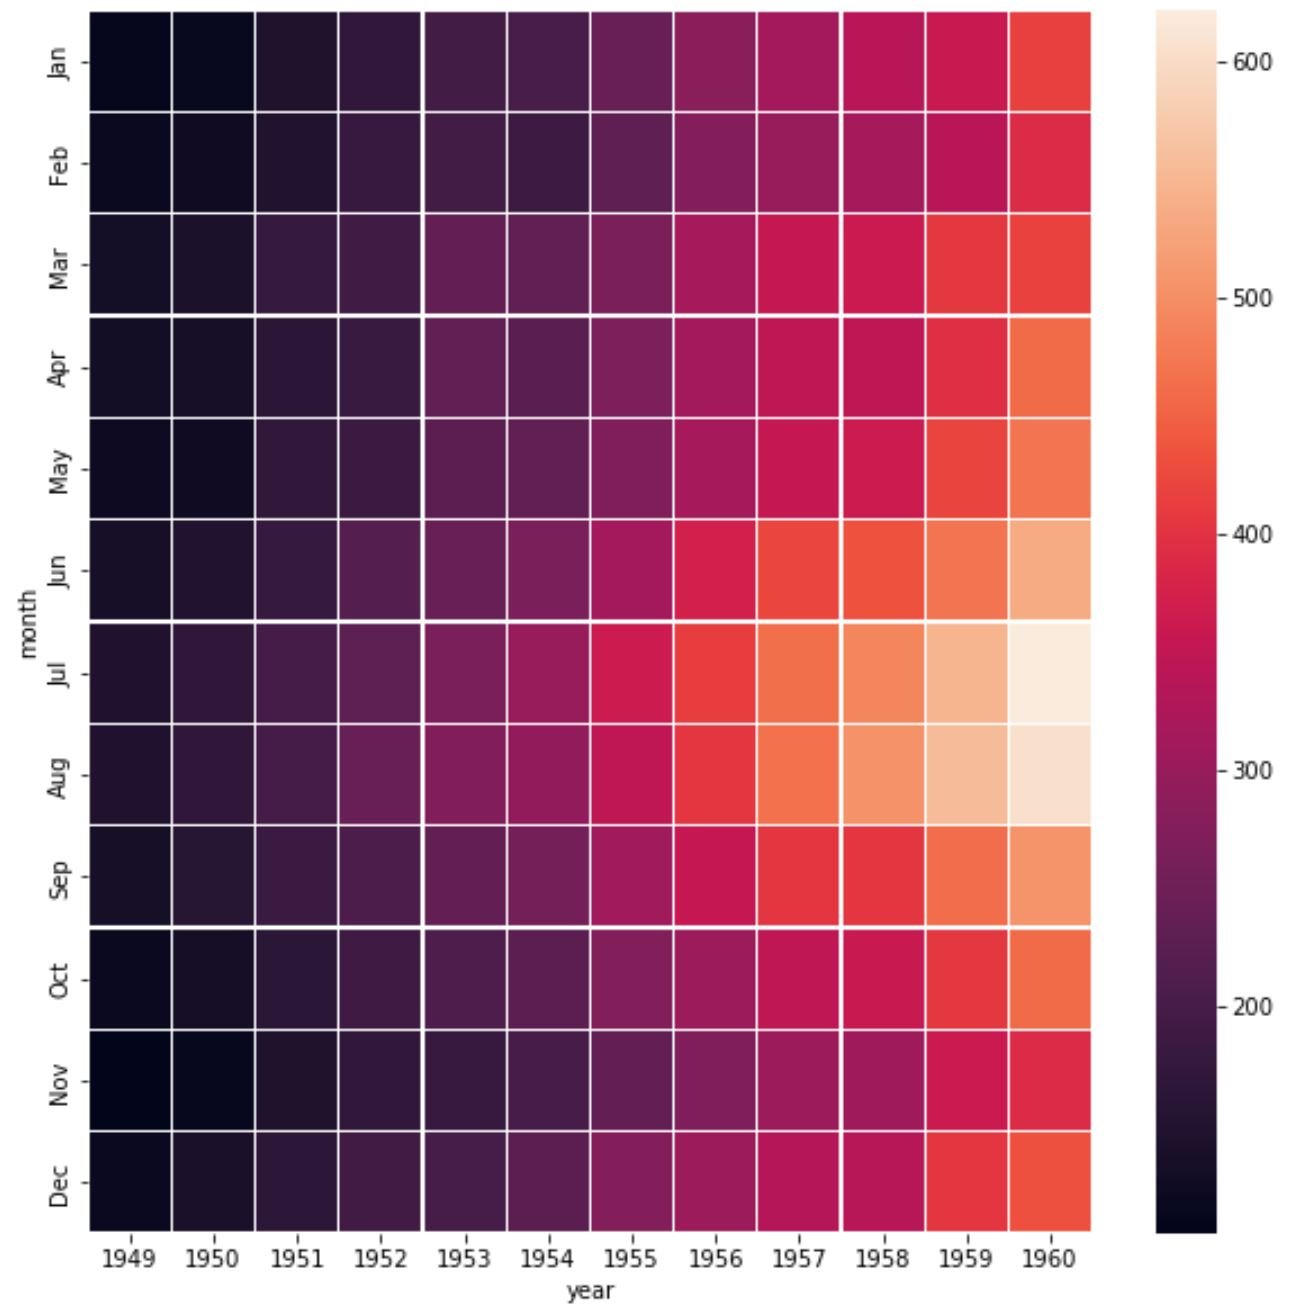
Or we could make the heatmap more wide by making the second argument in figsize smaller:
#specify size of heatmap
fig, ax = plt.subplots(figsize=(10, 5))

#create heatmap
sns.heatmap(data, linewidths=.3)
Feel free to modify the values in figsize to change the dimensions of the heatmap.
Additional Resources
The following tutorials explain how to perform other common operations in seaborn:
How to Add a Title to Seaborn Plots
How to Create Subplots in Seaborn
How to Change Font Size in Seaborn Plots