Quartiles are values that split up a dataset into four equal parts.
- The first quartile represents the 25th percentile of a dataset.
- The second quartile represents the 50th percentile of a dataset. This value is equivalent to the median value of the dataset.
- The third quartile represents the 75th percentile of a dataset.
We can easily calculate the quartiles of a given dataset in R by using the quantile() function.
This tutorial provides examples of how to use this function in practice.
Calculating Quartiles in R
The following code shows how to calculate the quartiles of a given dataset in R:
#define dataset
data = c(4, 7, 12, 13, 14, 15, 15, 16, 19, 23, 24, 25, 27, 28, 33)

#calculate quartiles of dataset
quantile(data)

  0%  25%  50%  75% 100%
 4.0 13.5 16.0 24.5 33.0
Here’s how to interpret the output:
- The first value displays the minimum value in the dataset: 4.0
- The second value displays the first quartile of the dataset: 13.5
- The third value displays the second quartile of the dataset: 16.0
- The fourth value displays the third quartile of the dataset: 24.5
- The fifth value displays the maximum value in the dataset: 33.0
Related: How to Easily Calculate Percentiles in R
Visualizing Quartiles in R
We can use the boxplot() function to create a boxplot to visualize the quartiles of this dataset in R:
#create boxplot
boxplot(data)
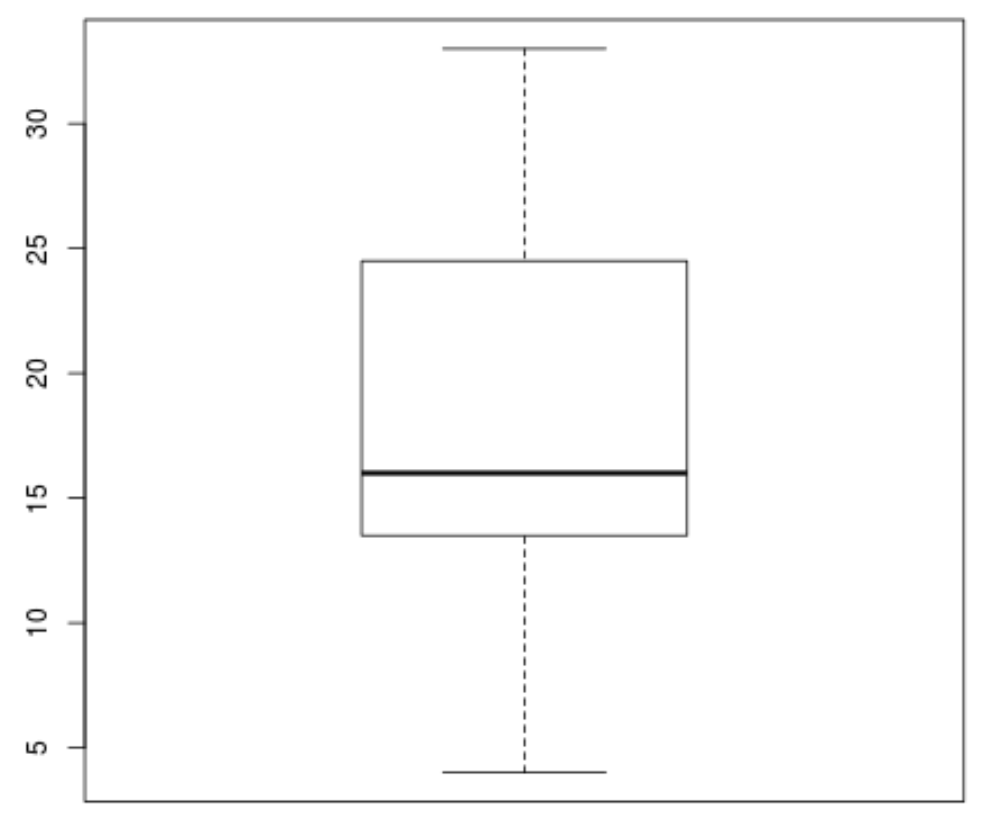
Here’s how to interpret the boxplot:
- The bottom “whisker” displays the minimum value of 4.
- The bottom line of the box displays the first quartile value of 13.5.
- The black bar in the middle of the box displays the second quartile value of 16.0.
- The top line of the box displays the third quartile value of 24.5.
- The top “whisker” displays the maximum value of 33.0.
This single plot helps us quickly visualize the distribution of values in the dataset.