A one sample t-test is used to test whether or not the mean of a population is equal to some value.
This tutorial explains how to conduct a one sample t-test in SPSS.
Example: One Sample t-test in SPSS
A botanist wants to know if the mean height of a certain species of plant is equal to 15 inches. She collects a random sample of 12 plants and records each of their heights in inches:

Use the following steps to perform a one sample t-test to determine if the true mean height of this species of plant is equal to 15 inches, based on the following null and alternative hypotheses:
- H0: μ = 15 (the true population mean is equal to 15 inches)
- H1: μ ≠ 15 (the true population mean is not equal to 15 inches)
Use a significance level of α = 0.05.
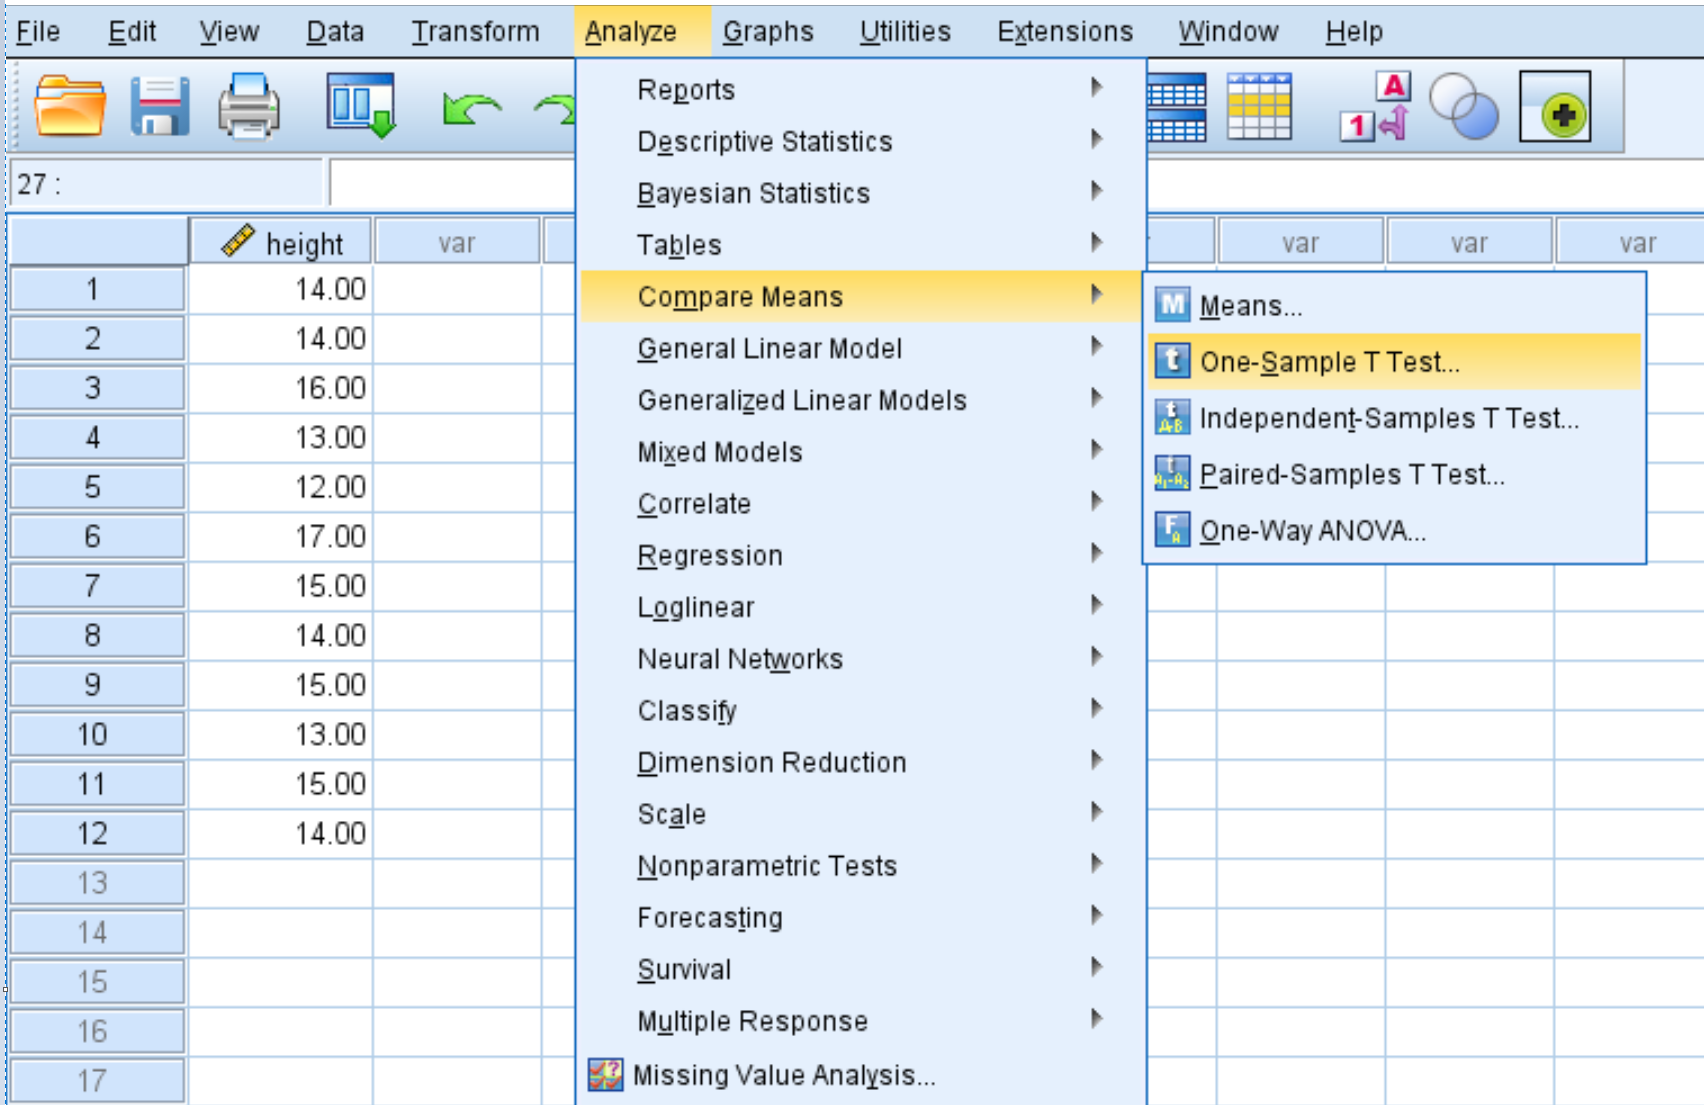
Step 1: Choose the One Sample t-test option.
Click the Analyze tab, then Compare Means, then One-Sample T Test:
Step 2: Fill in the necessary values to perform the one sample t-test.
Once you click One-Sample T Test, the following window will appear:

Drag the variable height into the box labelled Test Variable(s) and change the Test Value to 15. Then click OK.

Step 3: Interpret the results.
Once you click OK, the results of the one sample t-test will be displayed:
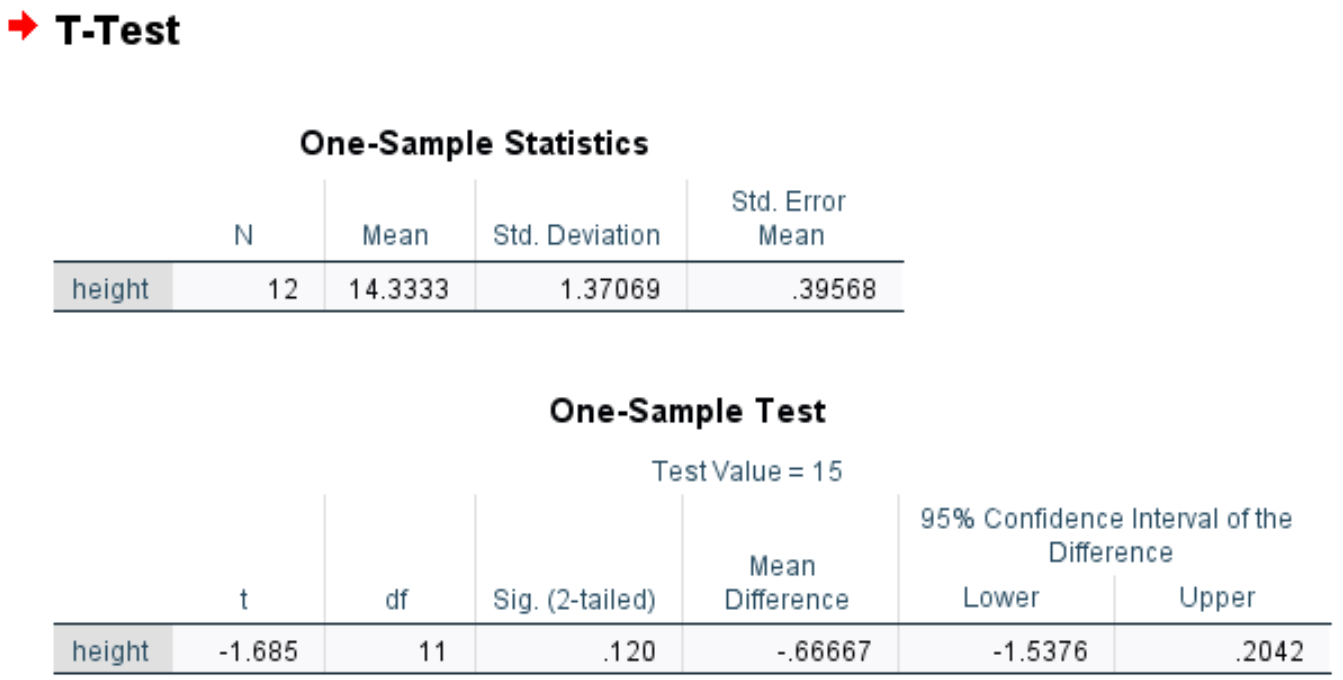
The first table displays summary statistics for the variable height:
- N: The sample size
- Mean: The mean height of plants in the sample
- Std. Deviation: The standard deviation of the height of plants in the sample.
- Std. Error Mean: The standard error of the mean, calculated as s/√n
The second table displays the results of the one sample t-test:
- t: The test statistic, calculated as (x – μ) / (s/√n) = (14.3333-15) / (1.37/√12) = -1.685
- df: The degrees of freedom, calculated as n-1 = 12-1 = 11
- Sig. (2-tailed): The two-sided p-value that corresponds to a t value of -1.685 with df=11
- Mean Difference: The difference between the sample mean and the hypothesized mean
- 95% C.I. of the Difference: The 95% confidence interval for the true difference between the sample mean and the hypothesized mean
Since the p-value of the test (.120) is not less than 0.05, we fail to reject the null hypothesis. We do not have sufficient evidence to say that the true mean height of this species of plant is different than 15 inches.