You can use the following basic syntax to set the axis ticks in a Matplotlib plot:
#set x-axis ticks (step size=2)
plt.xticks(np.arange(min(x), max(x)+1, 2))

#set y-axis ticks (step size=5)
plt.yticks(np.arange(min(y), max(y)+1, 5))
The following example shows how to use this syntax in practice.
Example: Set Axis Ticks in Matplotlib
Suppose we use the following code to create a line plot in Matplotlib:
import numpy as np
import matplotlib.pyplot as plt

#define data
x = [0, 2, 7, 10, 12, 15, 18, 20]
y = [0, 5, 9, 13, 19, 22, 29, 36]

#create line plot
plt.plot(x,y)

#display line plot
plt.show()
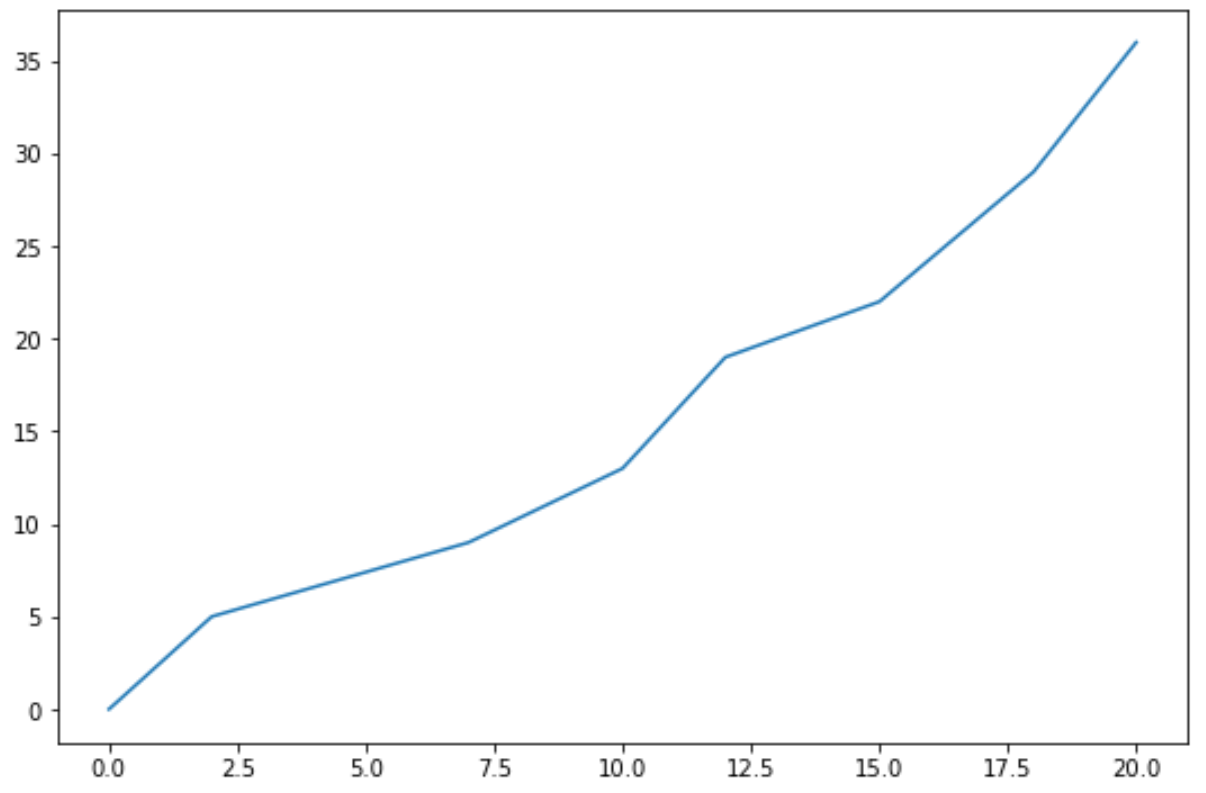
By default, Matplotlib has chosen to use a step size of 2.5 on the x-axis and 5 on the y-axis.
We can use the following code to change the step size on each axis:
import numpy as np
import matplotlib.pyplot as plt

#define data
x = [0, 2, 7, 10, 12, 15, 18, 20]
y = [0, 5, 9, 13, 19, 22, 29, 36]

#create line plot
plt.plot(x,y)

#specify axis tick step sizes
plt.xticks(np.arange(min(x), max(x)+1, 2))
plt.yticks(np.arange(min(y), max(y)+1, 4))

#display line plot
plt.show()
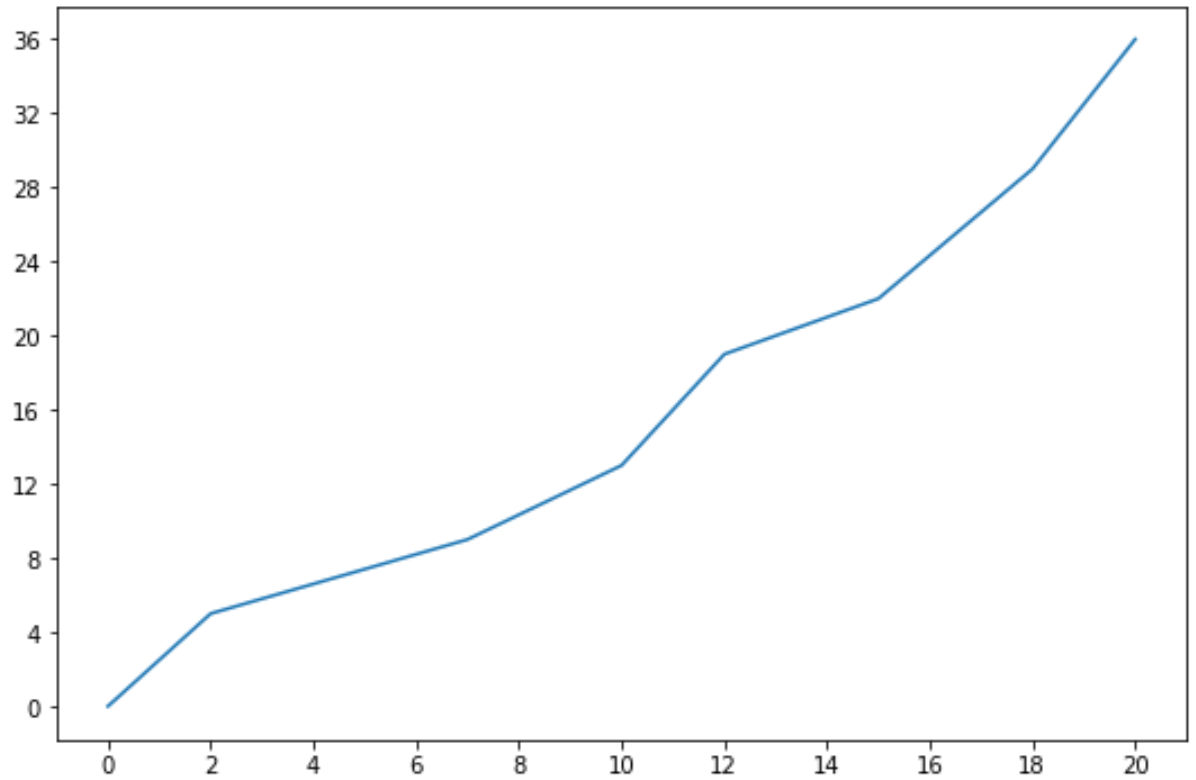
Notice that the step size on the x-axis is now 2 and the step size on the y-axis is 4.
Additional Resources
The following tutorials explain how to fix other common errors in Python:
How to Fix KeyError in Pandas
How to Fix: ValueError: cannot convert float NaN to integer
How to Fix: ValueError: operands could not be broadcast together with shapes