This tutorial explains how to create a heatmap in R using ggplot2.
Example: Creating a Heatmap in R
To create a heatmap, we’ll use the built-in R dataset mtcars.
#view first six rows of mtcars
head(mtcars)

#                   mpg cyl disp  hp drat    wt  qsec vs am gear carb
#Mazda RX4         21.0   6  160 110 3.90 2.620 16.46  0  1    4    4
#Mazda RX4 Wag     21.0   6  160 110 3.90 2.875 17.02  0  1    4    4
#Datsun 710        22.8   4  108  93 3.85 2.320 18.61  1  1    4    1
#Hornet 4 Drive    21.4   6  258 110 3.08 3.215 19.44  1  0    3    1
#Hornet Sportabout 18.7   8  360 175 3.15 3.440 17.02  0  0    3    2
#Valiant           18.1   6  225 105 2.76 3.460 20.22  1  0    3    1
Currently mtcars is in a wide format, but we need to melt it into a long format in order to create the heatmap.
#load reshape2 package to use melt() function
library(reshape2)

#melt mtcars into long format
melt_mtcars #add column for car name
melt_mtcars$car #view first six rows of melt_mtcars
head(melt_mtcars)

#  variable value               car
#1      mpg  21.0         Mazda RX4
#2      mpg  21.0     Mazda RX4 Wag
#3      mpg  22.8        Datsun 710
#4      mpg  21.4    Hornet 4 Drive
#5      mpg  18.7 Hornet Sportabout
#6      mpg  18.1           Valiant
We can use the following code to create the heatmap in ggplot2:
library(ggplot2)

ggplot(melt_mtcars, aes(variable, car)) +
  geom_tile(aes(fill = value), colour = "white") +
  scale_fill_gradient(low = "white", high = "red")
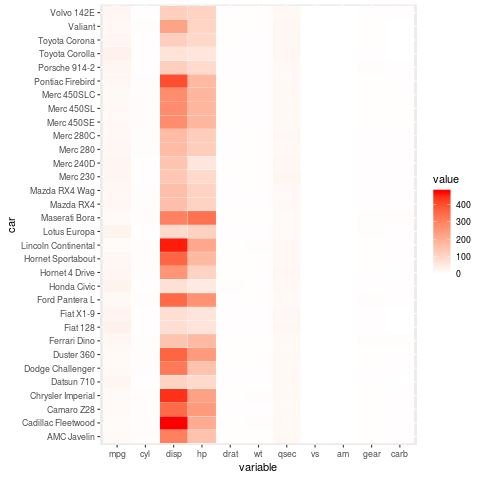
Unfortunately, since the values for disp are much larger than the values for all the other variables in the data frame, it’s hard to see the color variation for the other variables.
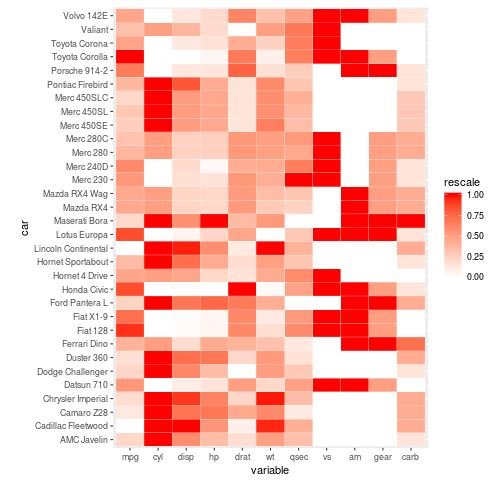
One way to solve this problem is to rescale the values for each variable from 0 to 1 using the rescale() function in the scales() package and the ddply() function in the plyr() package:
#load libraries
library(plyr)
library(scales)

#rescale values for all variables in melted data frame
melt_mtcars #create heatmap using rescaled values
ggplot(melt_mtcars, aes(variable, car)) +
  geom_tile(aes(fill = rescale), colour = "white") +
  scale_fill_gradient(low = "white", high = "red")
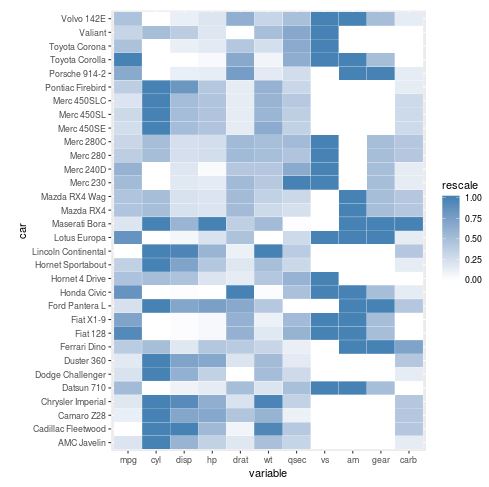
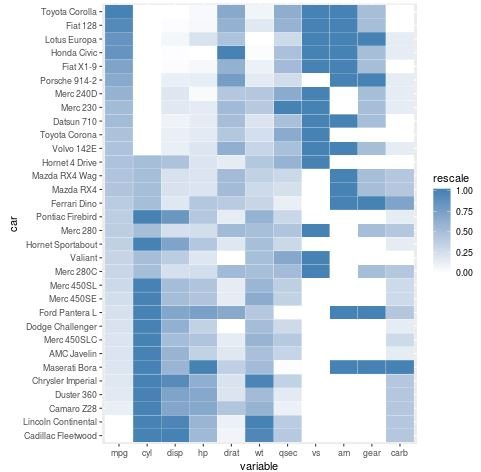
We can also change up the colors of the heatmap by changing the colors used in the scale_fill_gradient() argument:
#create heatmap using blue color scale
ggplot(melt_mtcars, aes(variable, car)) +
  geom_tile(aes(fill = rescale), colour = "white") +
  scale_fill_gradient(low = "white", high = "steelblue")
Note that the heatmap is currently ordered by car name. We could instead order the heatmap according to the values of one of the variables like mpg using the following code:
#define car name as a new column, then order by mpg descending
mtcars$car #melt mtcars into long format
melt_mtcars #rescale values for all variables in melted data frame
melt_mtcars #create heatmap using rescaled values
ggplot(melt_mtcars, aes(variable, car)) +
  geom_tile(aes(fill = rescale), colour = "white") +
  scale_fill_gradient(low = "white", high = "steelblue")
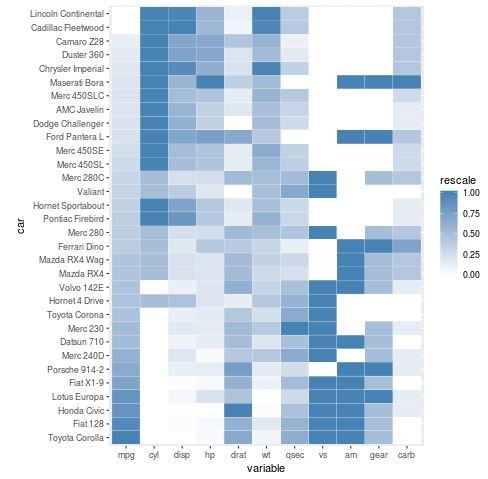
To order the heatmap by mpg ascending, we simply need to use -mpg in the reorder() argument:
#define car name as a new column, then order by mpg descending
mtcars$car -mpg))

#melt mtcars into long format
melt_mtcars #rescale values for all variables in melted data frame
melt_mtcars #create heatmap using rescaled values
ggplot(melt_mtcars, aes(variable, car)) +
  geom_tile(aes(fill = rescale), colour = "white") +
  scale_fill_gradient(low = "white", high = "steelblue")
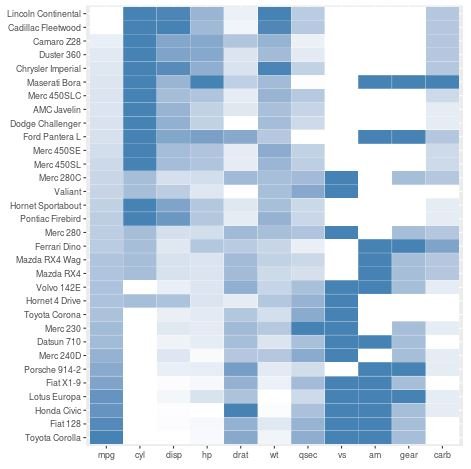
Lastly, we can remove the x-axis and y-axis labels along with the legend if we don’t like how it looks using the labs() and theme() arguments:
#create heatmap with no axis labels or legend
ggplot(melt_mtcars, aes(variable, car)) +
  geom_tile(aes(fill = rescale), colour = "white") +
  scale_fill_gradient(low = "white", high = "steelblue") +
  labs(x = "", y = "") +
  theme(legend.position = "none")