The standard error of a regression slope is a way to measure the “uncertainty” in the estimate of a regression slope.
It is calculated as:
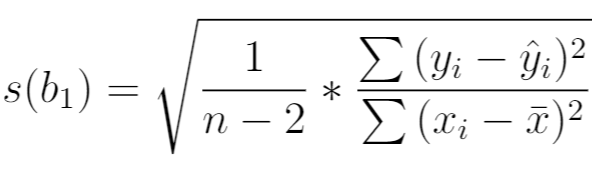
where:
- n: total sample size
- yi: actual value of response variable
- ŷi: predicted value of response variable
- xi: actual value of predictor variable
- x̄: mean value of predictor variable
The smaller the standard error, the lower the variability around the coefficient estimate for the regression slope.
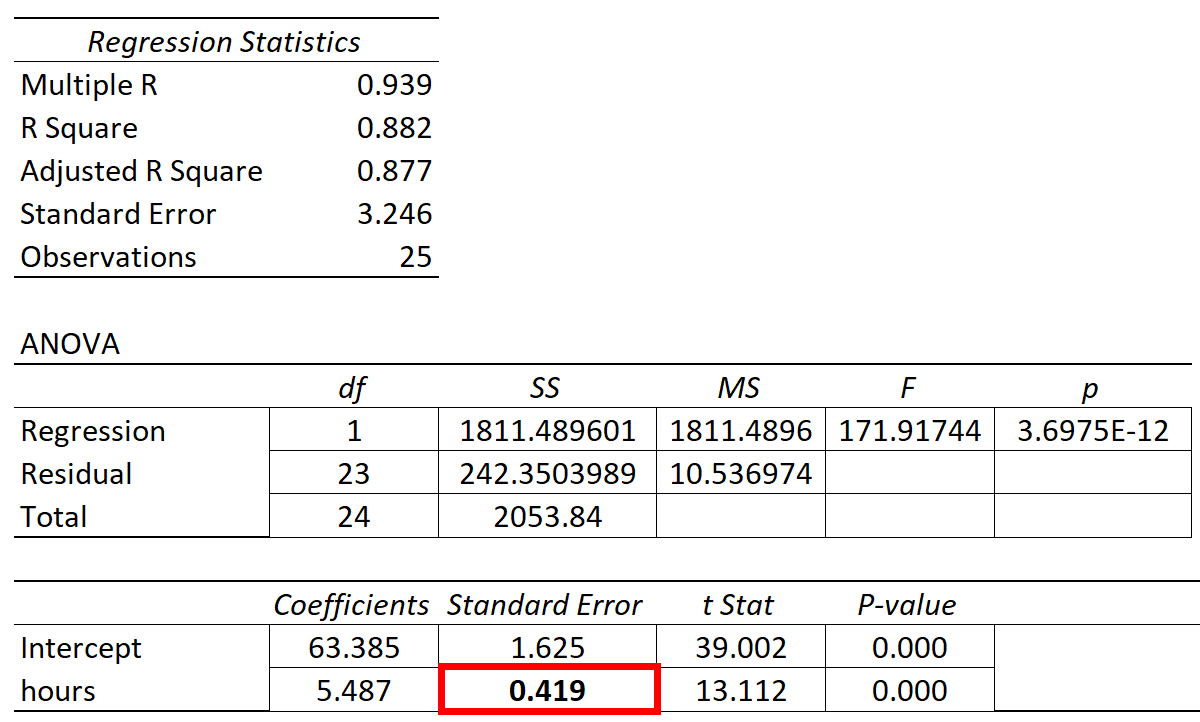
The standard error of the regression slope will be displayed in a “standard error” column in the regression output of most statistical software:
The following examples show how to interpret the standard error of a regression slope in two different scenarios.
Example 1: Interpreting a Small Standard Error of a Regression Slope
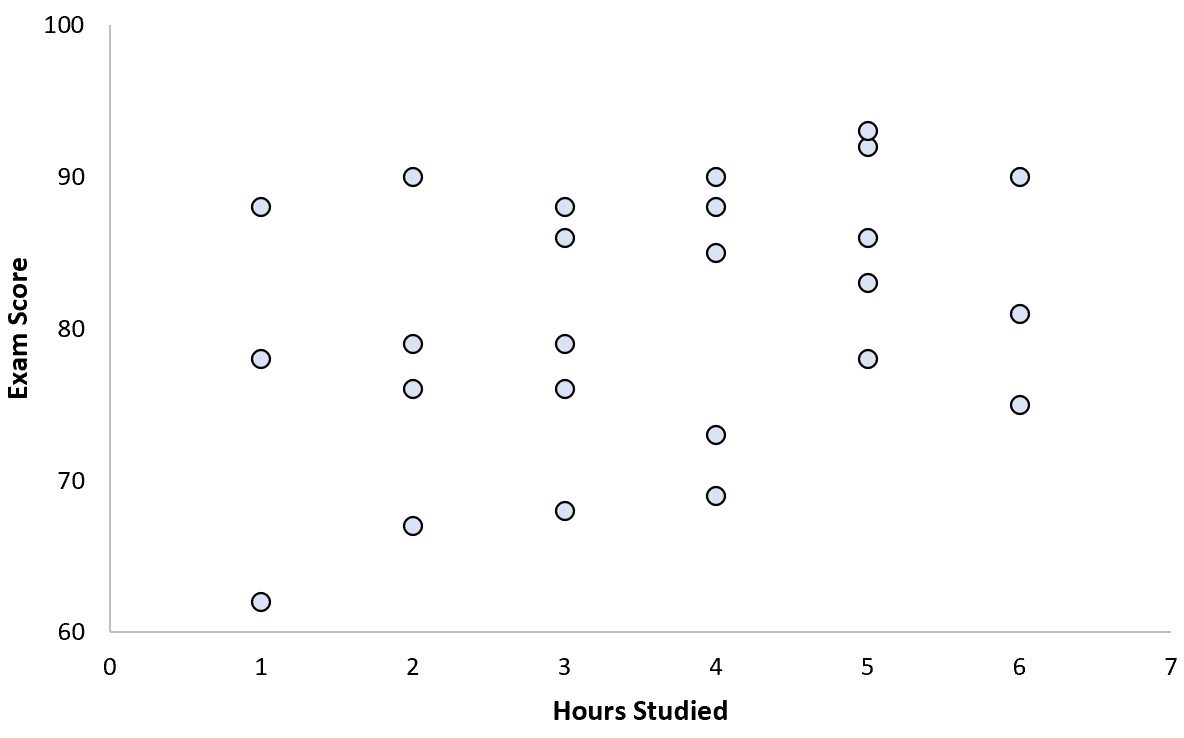
Suppose a professor wants to understand the relationship between the number of hours studied and the final exam score received for students in his class.
He collects data for 25 students and creates the following scatterplot:

There is a clear positive association between the two variables. As hours studied increases, the exam score increases at a fairly predictable rate.
He then fits a simple linear regression model using hours studied as the predictor variable and final exam score as the response variable.
The following table shows the results of the regression:
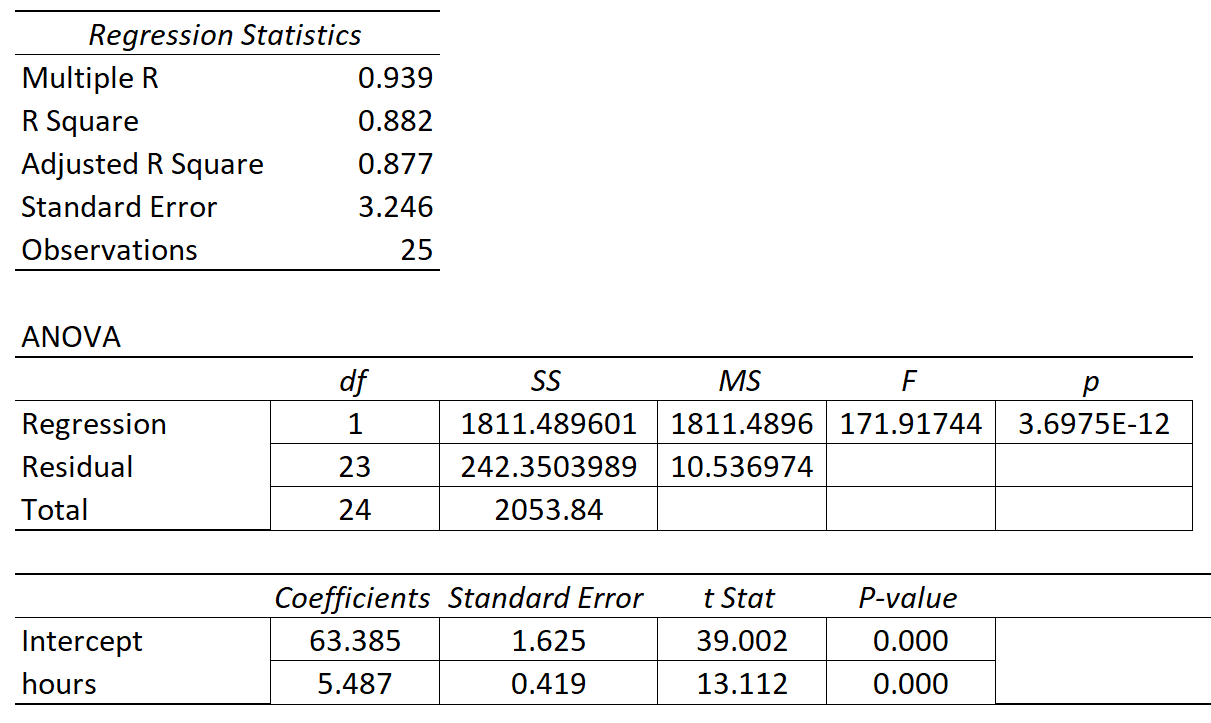
The coefficient for the predictor variable ‘hours studied’ is 5.487. This tells us that each additional hour studied is associated with an average increase of 5.487 in exam score.
The standard error is 0.419, which is a measure of the variability around this estimate for the regression slope.
We can use this value to calculate the t-statistic for the predictor variable ‘hours studied’:
- t-statistic = coefficient estimate / standard error
- t-statistic = 5.487 / .419
- t-statistic = 13.112
The p-value that corresponds to this test statistic is 0.000, which indicates that ‘hours studied’ has a statistically significant relationship with final exam score.
Since the standard error of the regression slope was small relative to the coefficient estimate of the regression slope, the predictor variable was statistically significant.
Example 2: Interpreting a Large Standard Error of a Regression Slope
Suppose a different professor wants to understand the relationship between the number of hours studied and the final exam score received for students in her class.
She collects data for 25 students and creates the following scatterplot:
There appears to be slight positive association between the two variables. As hours studied increases, the exam score generally increases but not at a predictable rate.
Suppose the professor then fits a simple linear regression model using hours studied as the predictor variable and final exam score as the response variable.
The following table shows the results of the regression:
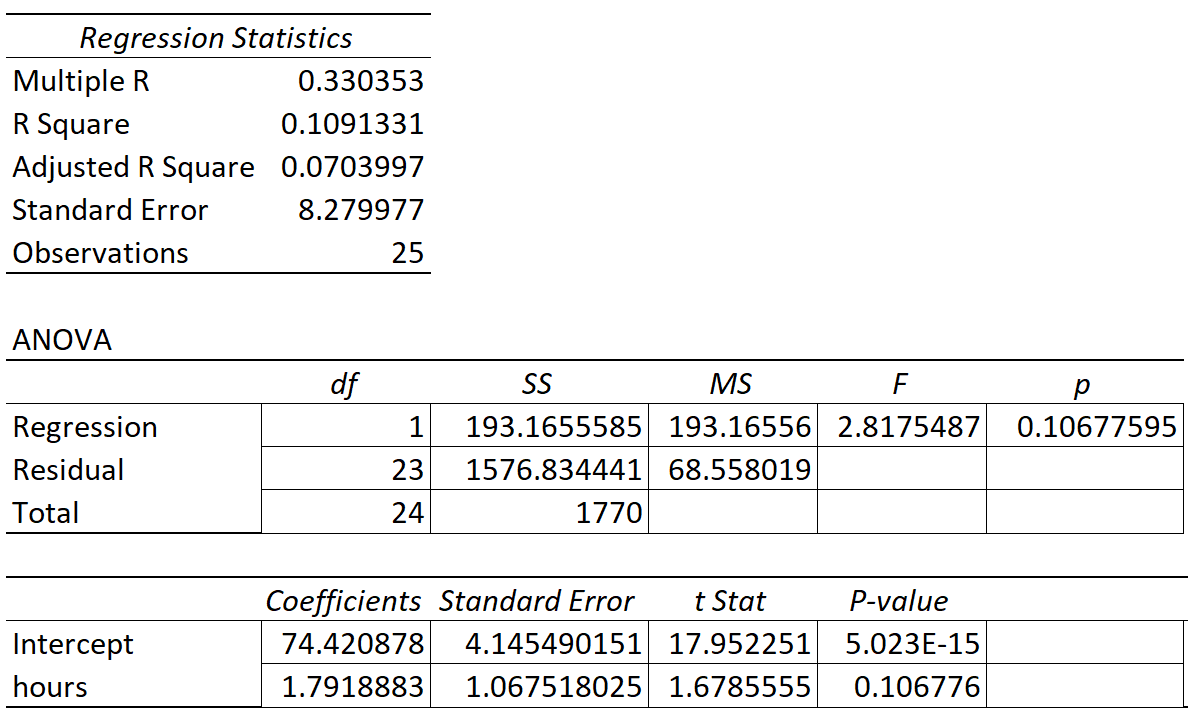
The coefficient for the predictor variable ‘hours studied’ is 1.7919. This tells us that each additional hour studied is associated with an average increase of 1.7919 in exam score.
The standard error is 1.0675, which is a measure of the variability around this estimate for the regression slope.
We can use this value to calculate the t-statistic for the predictor variable ‘hours studied’:
- t-statistic = coefficient estimate / standard error
- t-statistic = 1.7919 / 1.0675
- t-statistic = 1.678
The p-value that corresponds to this test statistic is 0.107. Since this p-value is not less than .05, this indicates that ‘hours studied’ does not have a statistically significant relationship with final exam score.
Since the standard error of the regression slope was large relative to the coefficient estimate of the regression slope, the predictor variable was not statistically significant.
Additional Resources
Introduction to Simple Linear Regression
Introduction to Multiple Linear Regression
How to Read and Interpret a Regression Table