The mean represents the average value in a dataset. It gives us a good idea of where the center of a dataset is located.
The standard deviation represents how spread out the values are in a dataset. It gives us an idea of how closely the observations are clustered around the mean.
Using only these two values, we can understand a great deal about the distribution of values in a dataset.
To calculate the mean of a dataset in Google Sheets, we can use the =AVERAGE(Range) function where Range is the range of values.
To calculate the standard deviation of a dataset, we can use the =STDEV.S(Range) function, where Range is the range of values.
This tutorial explains how to use these functions in practice.
Technical Note
Both the STDEV() and STDEV.S() function calculate the sample standard deviation.
You can use the STDEV.P() function to calculate the population standard deviation if your dataset represents the entire population of values.
However, in most cases we’re working with sample data rather than an entire population so we use the STDEV.S() function.
Example 1: Mean & Standard Deviation of a Single Dataset
The following screenshot shows how to calculate the mean and standard deviation of a single dataset in Google Sheets:
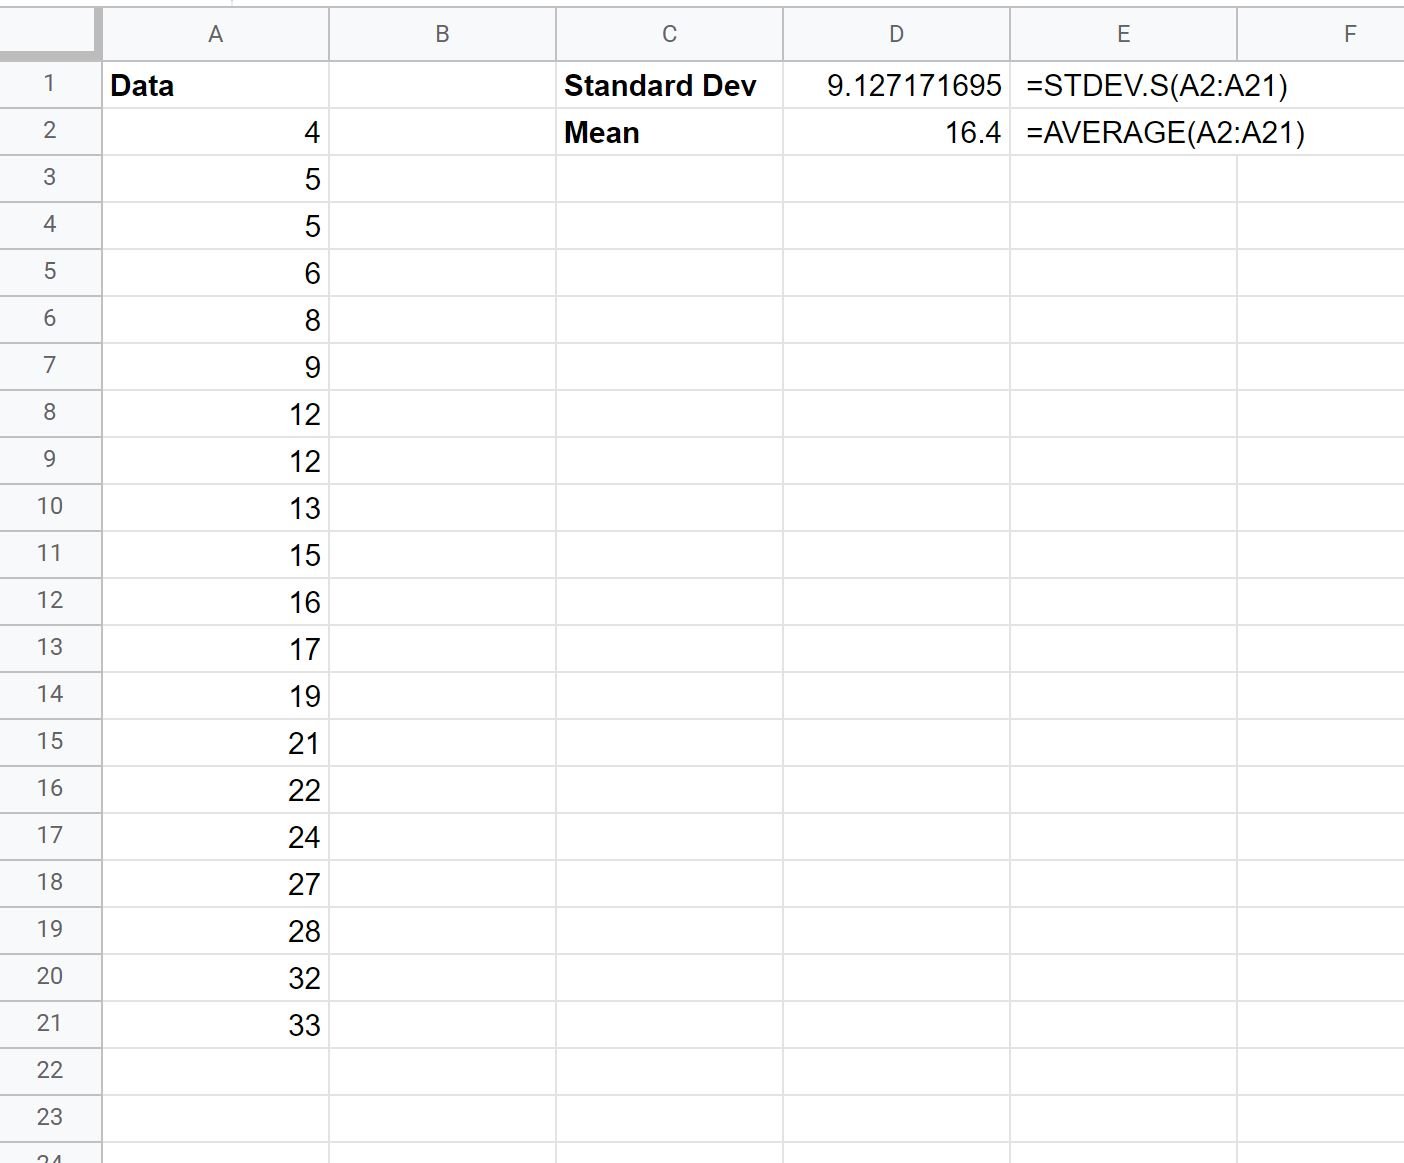
The mean of the dataset is 16.4 and the standard deviation is 9.127.
Column E shows the formulas we used to calculate both the mean and standard deviation of the dataset.
Example 2: Mean & Standard Deviation of Multiple Datasets
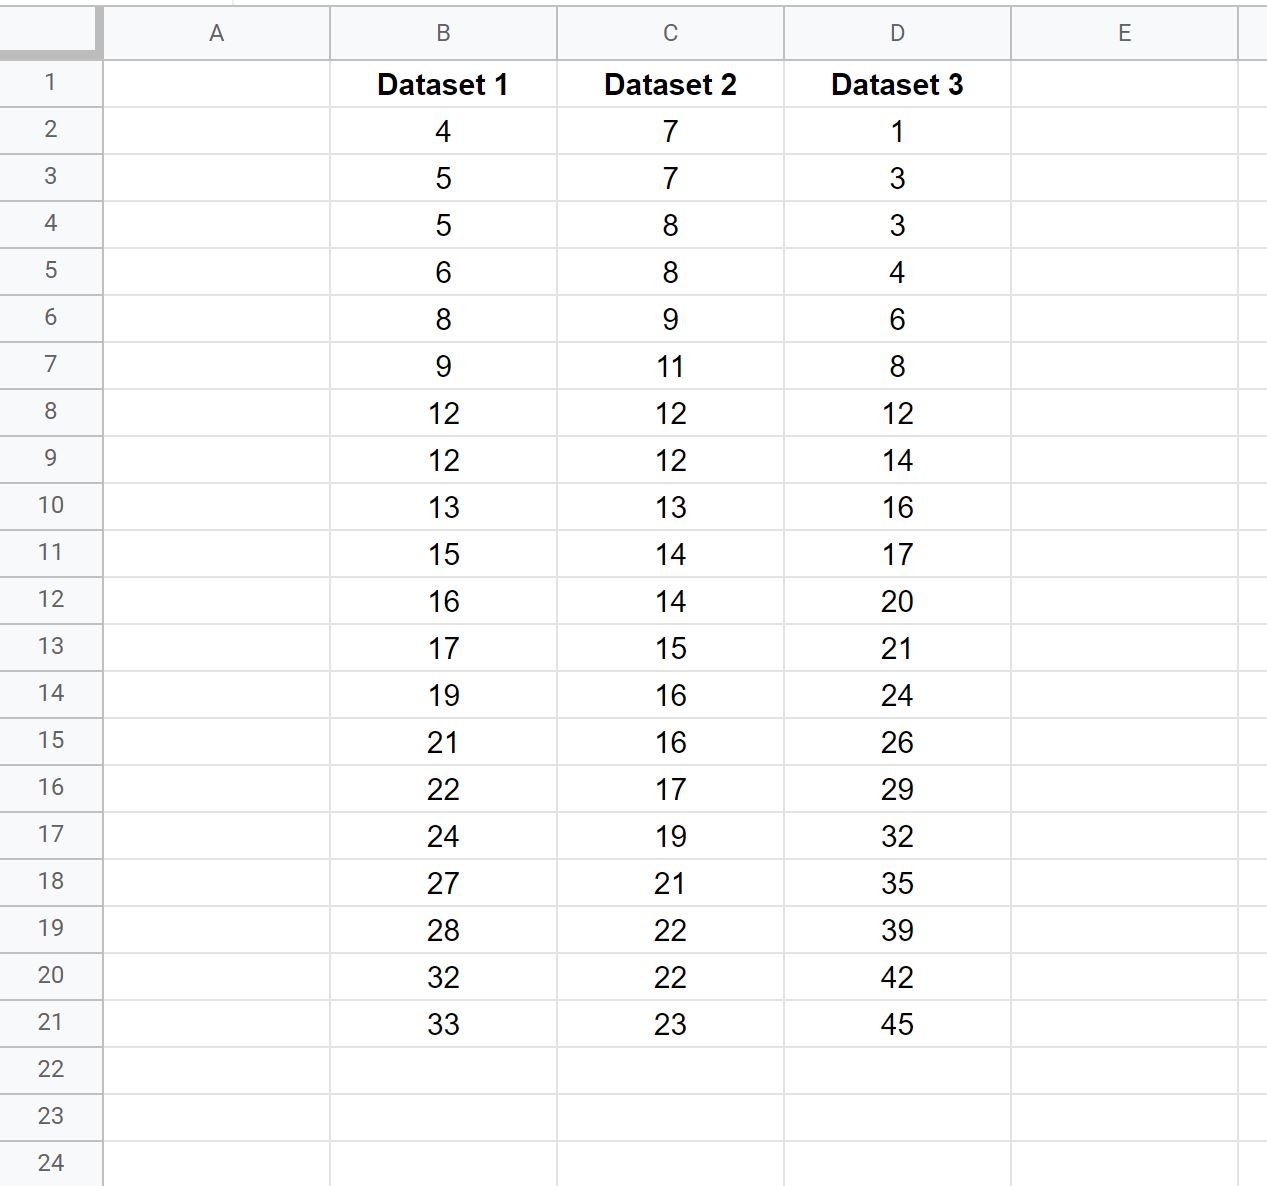
Suppose we have multiple datasets in Google Sheets:
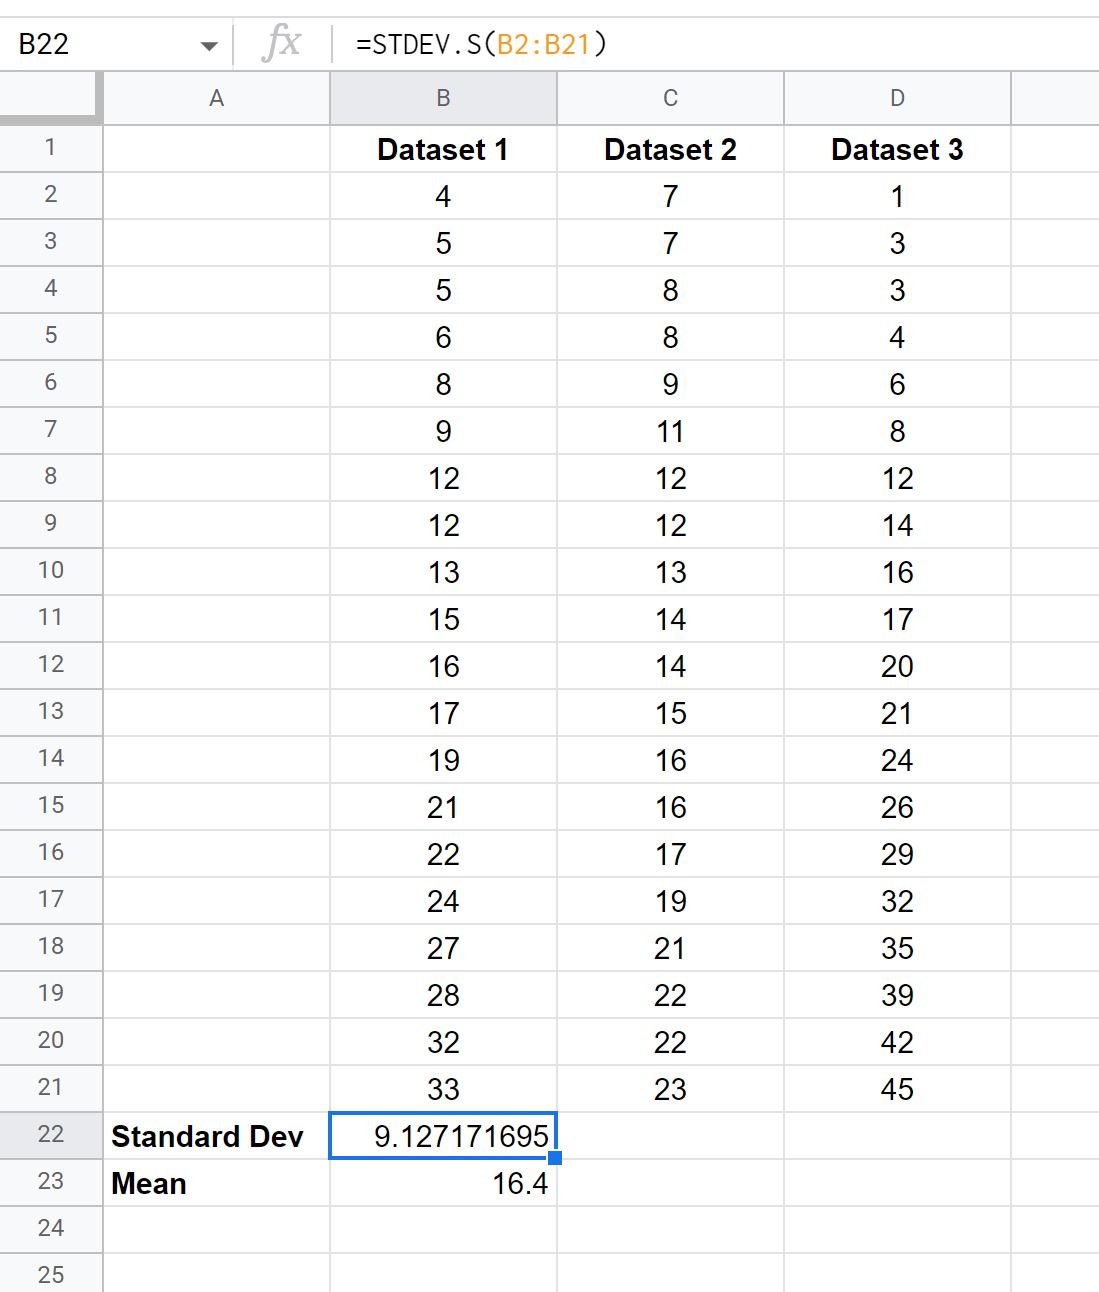
To calculate the mean and standard deviation of the first dataset, we can use the following two formulas:
- Mean: =AVERAGE(B2:B21)
- Standard Deviation: =STDEV.S(B2:B21)
Next, we can highlight cells B22:B23 and drag the formulas over to the next two columns:
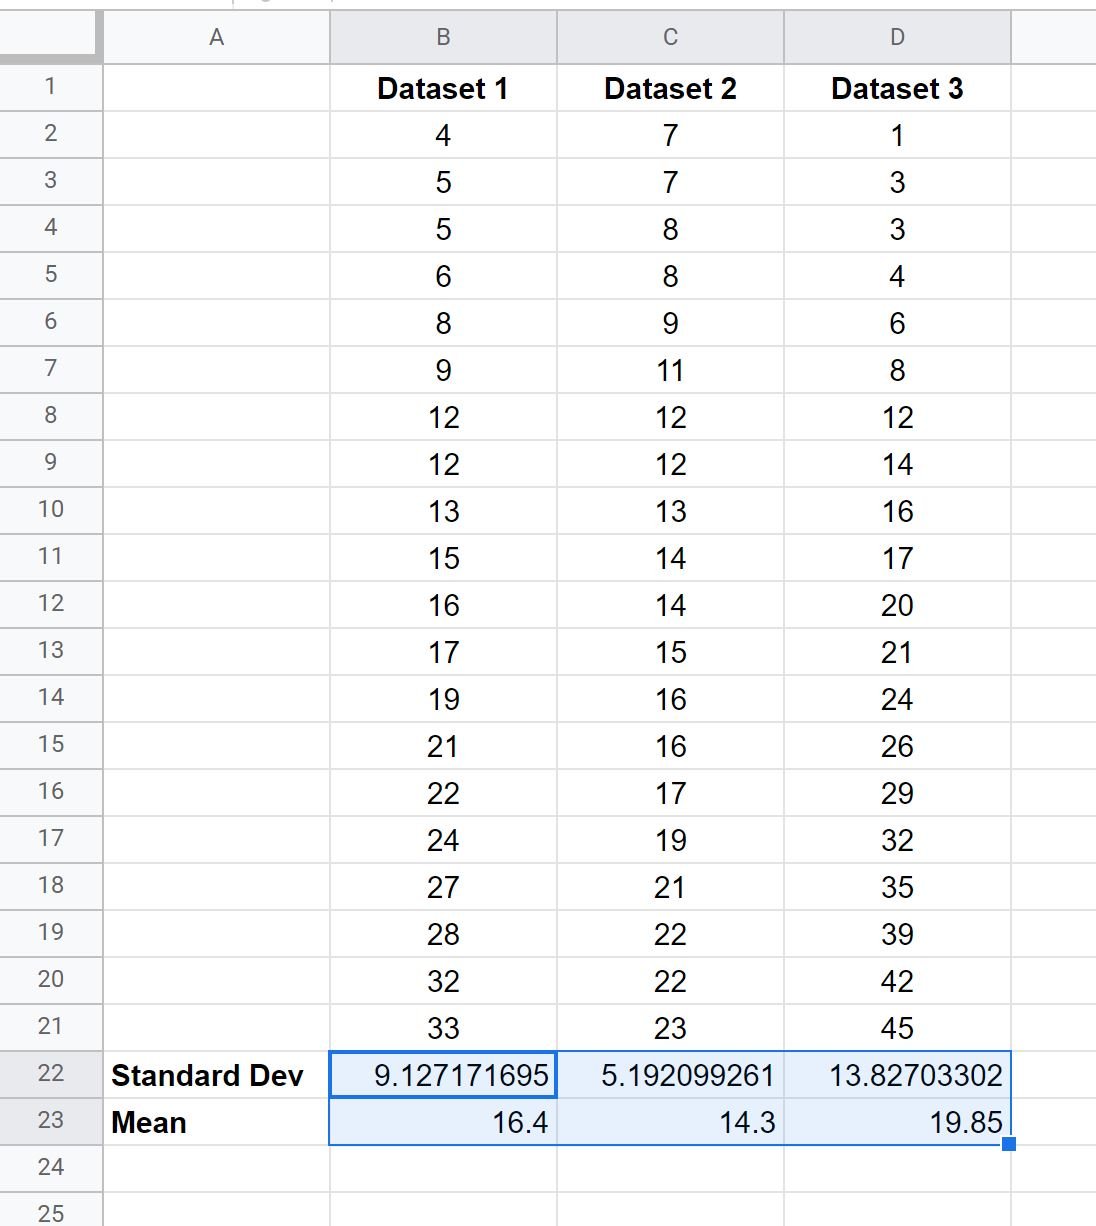
The results show the mean and standard deviation for each of the three datasets.
Additional Resources
The following tutorials explain how to perform other common tasks in Google Sheets:
How to Calculate the Interquartile Range in Google Sheets
How to Calculate a Five Number Summary in Google Sheets
How to Find the Top 10% of Values in Google Sheets