A dichotomous variable is a type of variable that only takes on two possible values.
Some examples of dichotomous variables include:
- Gender: Male or Female
- Coin Flip: Heads or Tails
- Property Type: Residential or Commercial
- Athlete Status: Professional or Amateur
- Exam Results: Pass or Fail
These types of variables occur all the time in practice. For example, consider the following dataset that contains 10 observations and 4 variables:
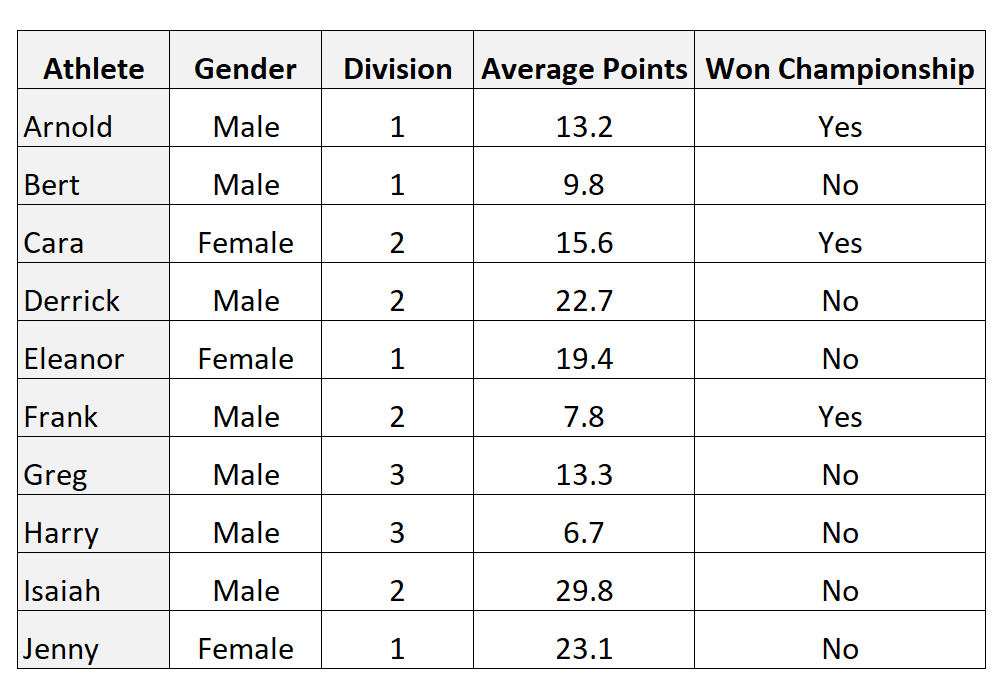
The variables gender and Won Championship are dichotomous because they can each only take on two possible values:
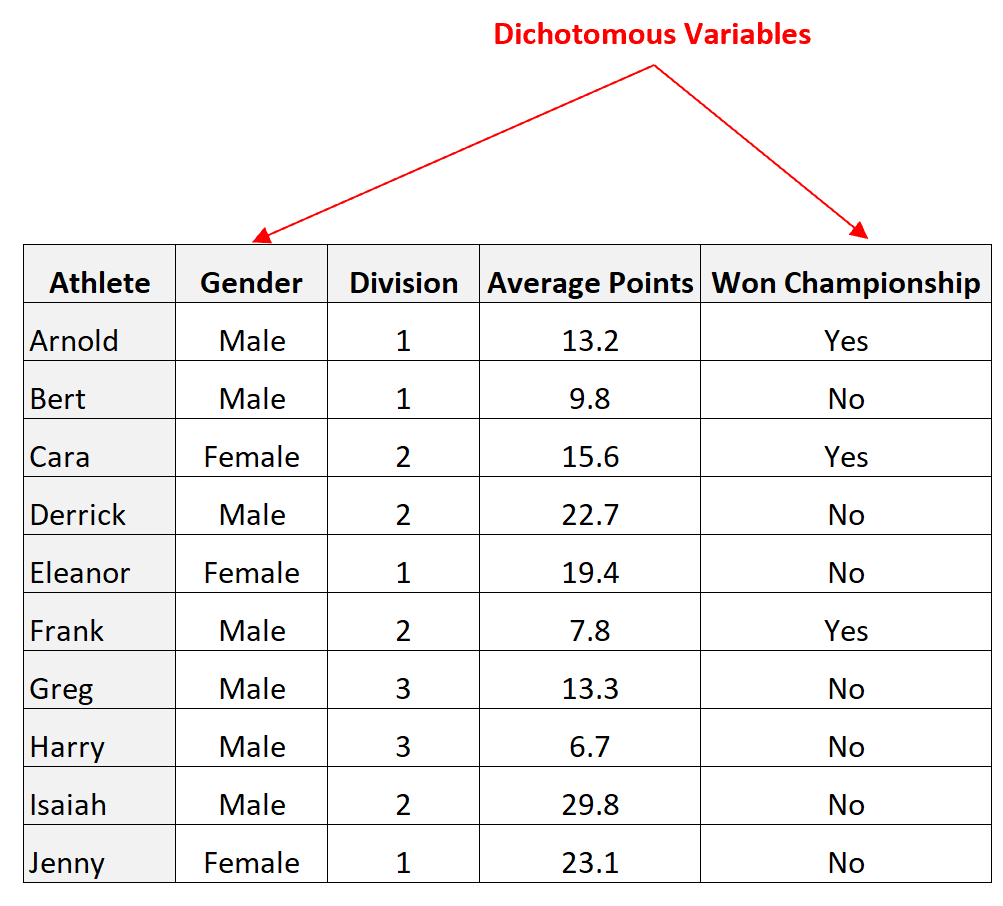
However, the variables Division and Average Points are not dichotomous because they can take on multiple values.
Bonus Tip:
You can remember that dichotomous variables can only take on two values by remembering that the prefix “di” is a Greek word that means “two”, “twice”, or “double.”
How to Create Dichotomous Variables
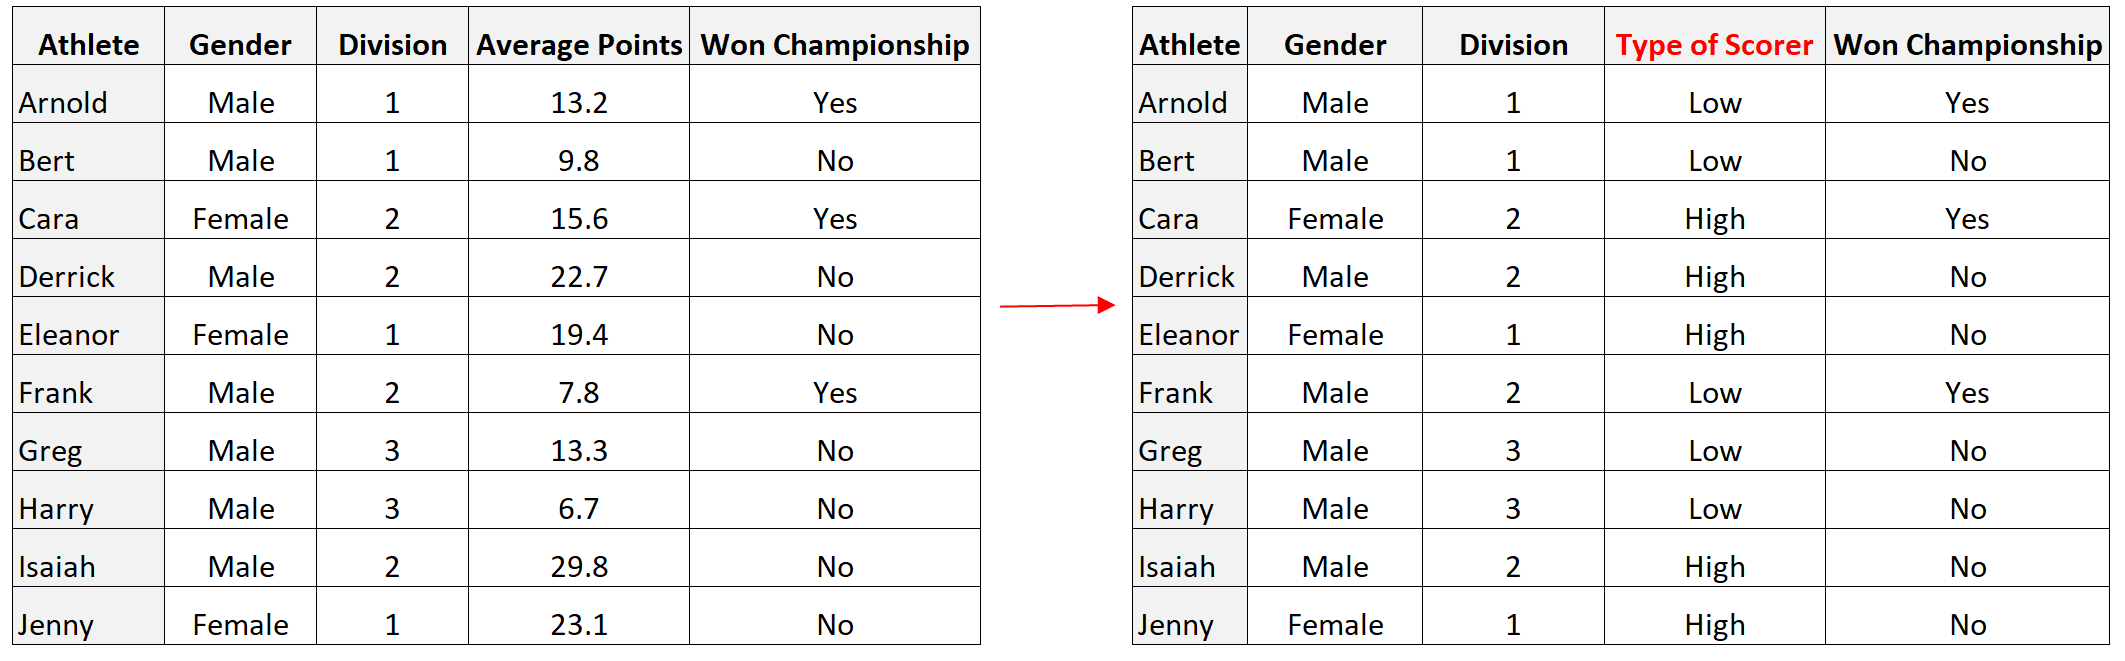
It’s worth noting that we can create a dichotomous variable from a continuous variable by simply separating values based on some threshold.
For example, in the previous dataset we could turn the variable Average Points into a dichotomous variable by classifying players with an average above 15 as “high scorers” and those with an average below 15 as “low scorers”:
How to Visualize Dichotomous Variables
We typically visualize dichotomous variables by using a simple bar chart to represent the frequencies of each value it can take on.
For example, the following bar chart shows the frequencies of each gender in the previous dataset:
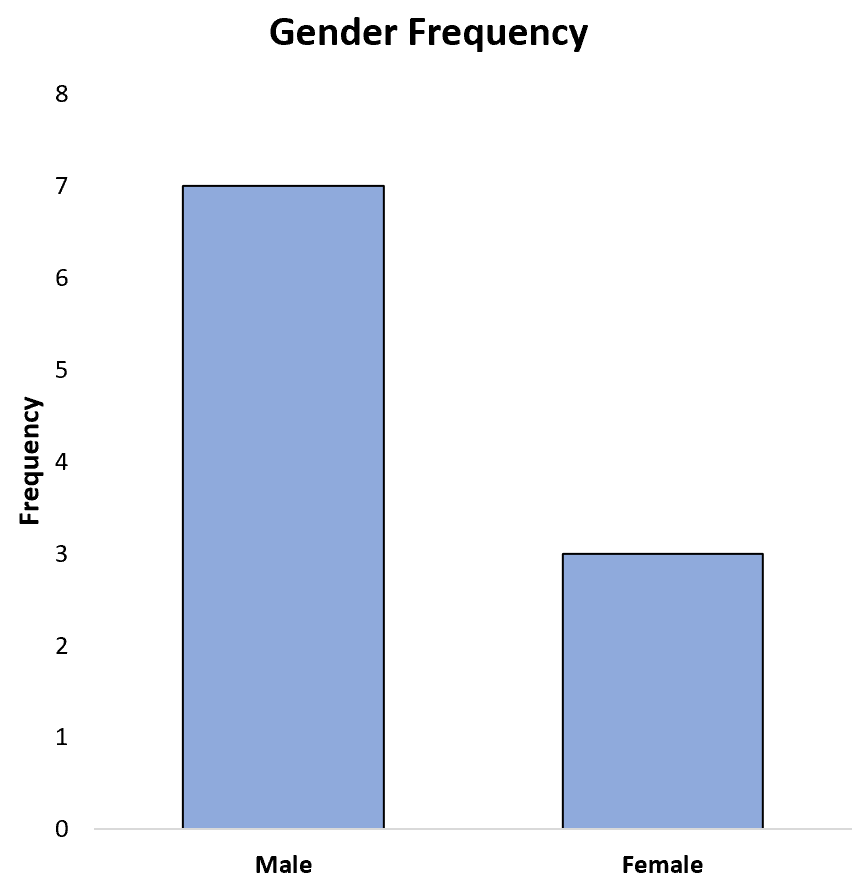
We could also display the frequencies as percentages on the y-axis:
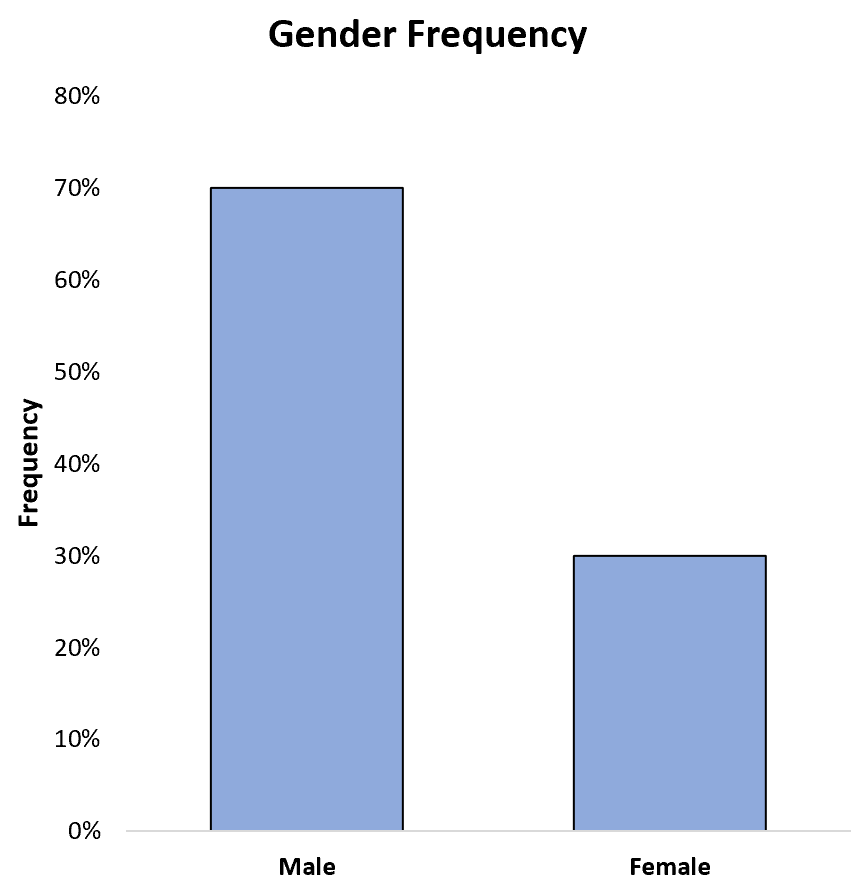
This allows us to easily see that 70% of the total athletes in the dataset are male and 30% are female.
How to Analyze Dichotomous Variables
There are several ways to analyze dichotomous variables. Two of the most common ways include:
1. One proportion z-test
A one proportion z-test determines whether or not some observed proportion is equal to a theoretical one.
For example, we might use this test to determine if the true proportion of athletes who are male in some population is equal to 50%.
2. Point-biserial correlation
Point-biserial correlation is used to measure the relationship between a dichotomous variable and a continuous variable.
This type of correlation takes on a value between -1 and 1 where:
- -1 indicates a perfectly negative correlation between two variables
- 0 indicates no correlation between two variables
- 1 indicates a perfectly positive correlation between two variables
For example, we might calculate the point-biserial correlation between gender and average points per game to understand how strongly these two variables are related.